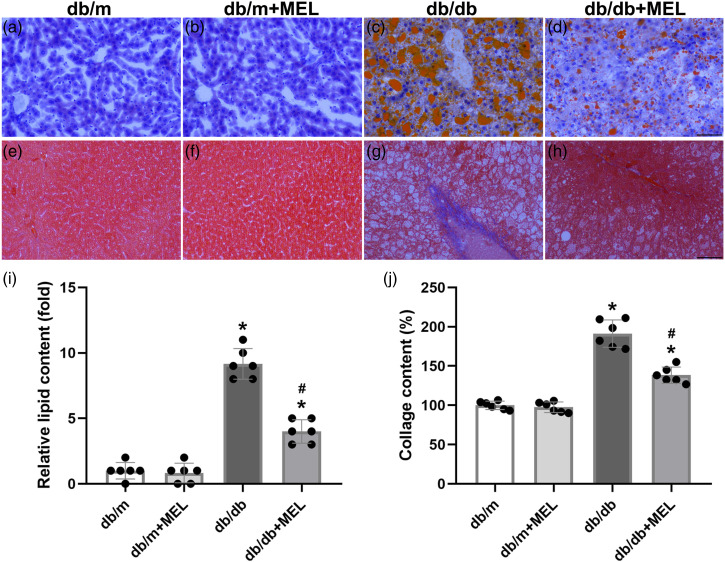
Figure 3.
Effect of melatonin administration on the hepatic steatosis and fibrosis in db/db mice. Representative images of Oil Red O staining (a–d) and (i) quantitative analysis of lipid content. Masson’s staining of livers (e–h) and (j) quantitative analysis of collage content. (×200; scale bar, 100 μm). Values are mean ± SD, (n = 6). *p < 0.05 vs db/m, #p < 0.05 vs db/db.

