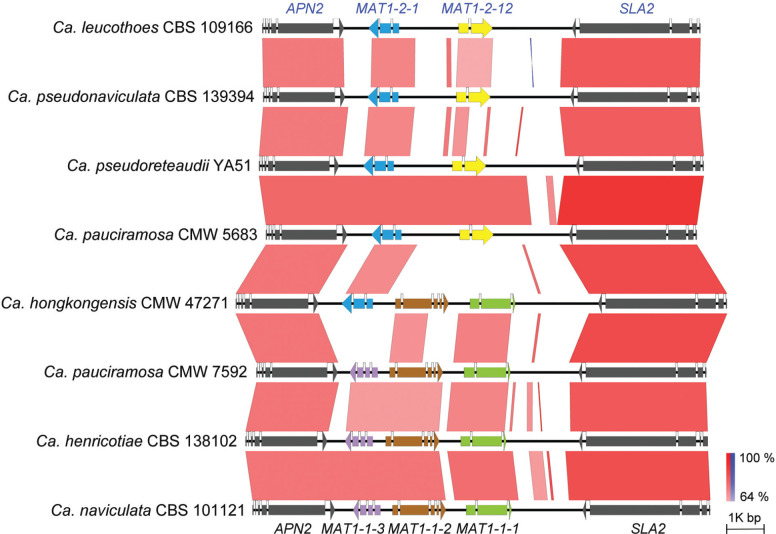
Fig. 1.
Pairwise MAT loci comparison among eight Calonectria isolates representing seven species. Black horizontal lines represent genomic sequences. Colour coded arrows represent annotated genes. Red or blue boxes between genomic sequences indicates pairwise similarity based on BLASTn; red suggest that both regions are in the same orientation and blue are in opposite directions. Calonectria hongkongensis CMW 47271 represents the only homothallic individual containing both MAT1-1 and MAT1-2 idiomorph.

