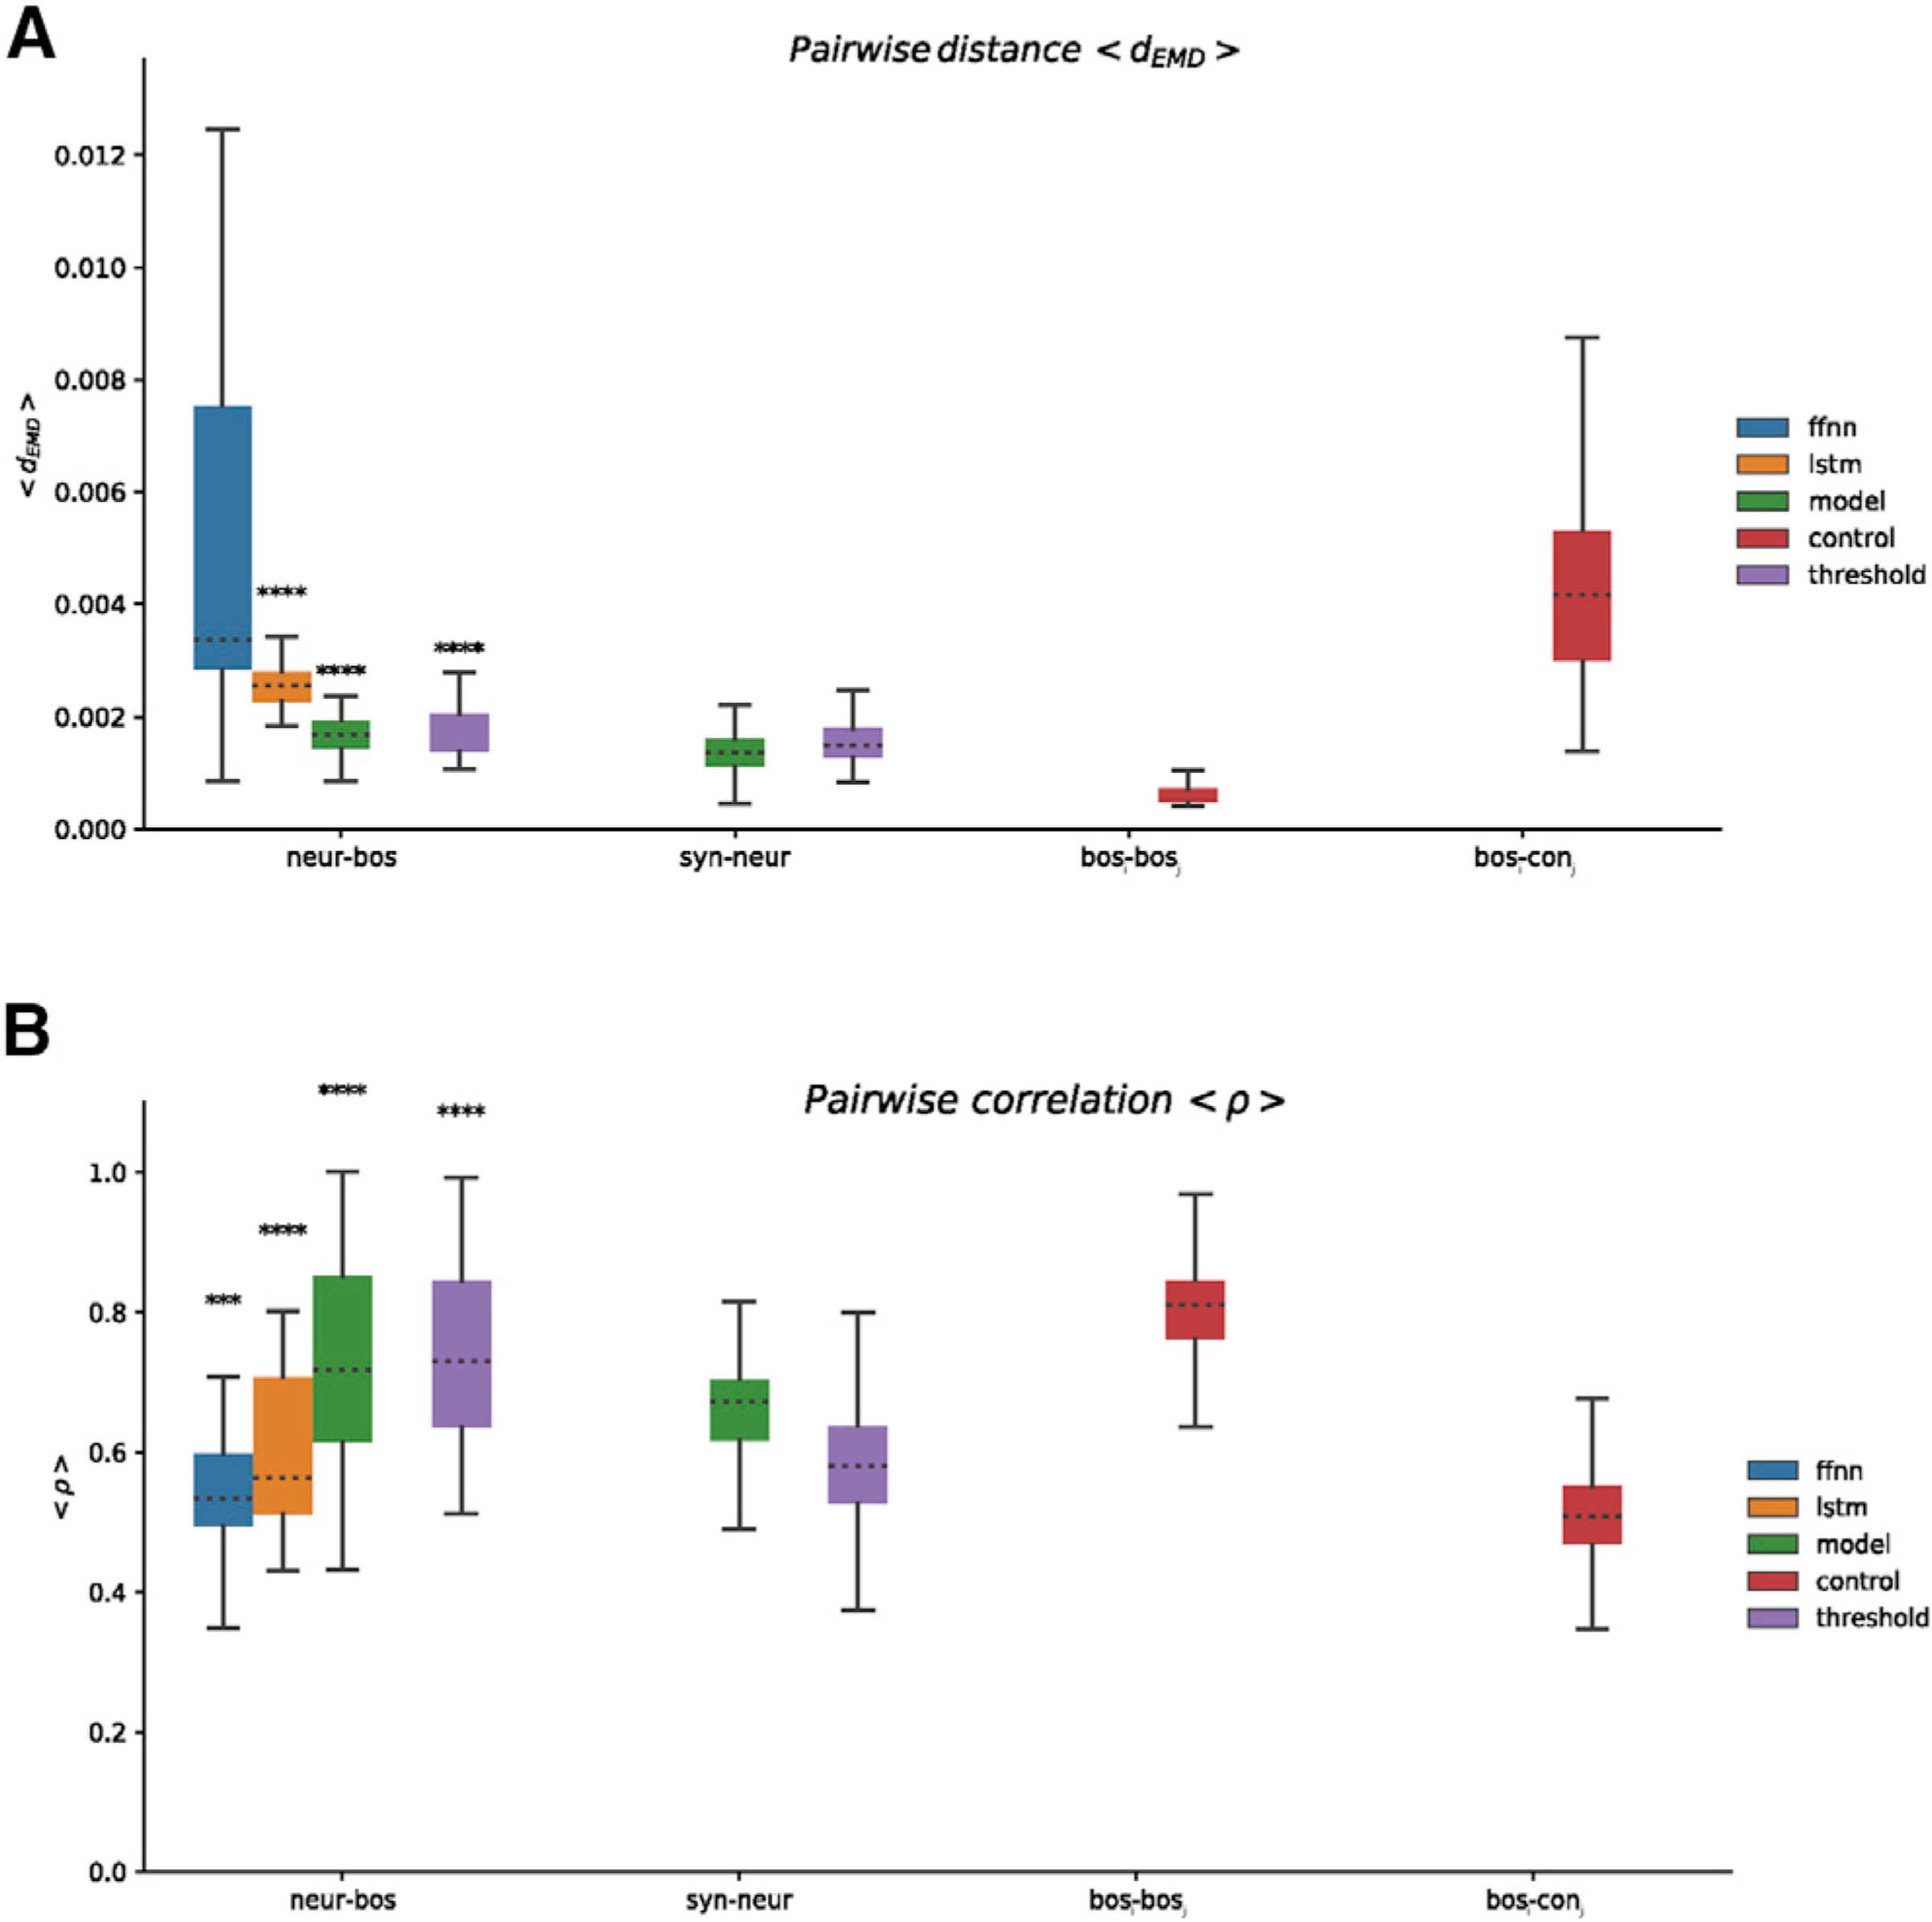
Figure 4. Performance comparisons aggregated for all birds.

(A) Boxplots showing time-averaged earth mover’s distance (< dEMD >; lower = better). Neur-bos, distance between each pair of synthesized or target spectrograms in the test set. Ffnn and lstm indicate training directly with spectrogram via a FFNN and LSTM using sorted spikes, model indicates training or synthesis via the biomechanical model of the vocal organ using sorted spikes, and threshold indicates the same training or testing as in model, albeit using supra-threshold activity instead of sorted spikes. Syn-neur indicates the distance between the synthetic instance of each motif in the testing set (the one produced when fitting the parameters of the biomechanical model for a given motif) and the one synthesized from neural activity. Bosi-bosj indicates distance between each pair of motifs of BOS. Bosi-conj indicates distance between pairs of bos and songs from a pool of conspecific birds.
(B) Boxplots showing time-averaged spectral correlation (< ρ >; higher = better); same pairs as in (A) (***p < 0.001; ****p < 0.0001; Mann-Whitney U test, one sided against bosi-conj). Performance for each bird is shown in Figure S3.
