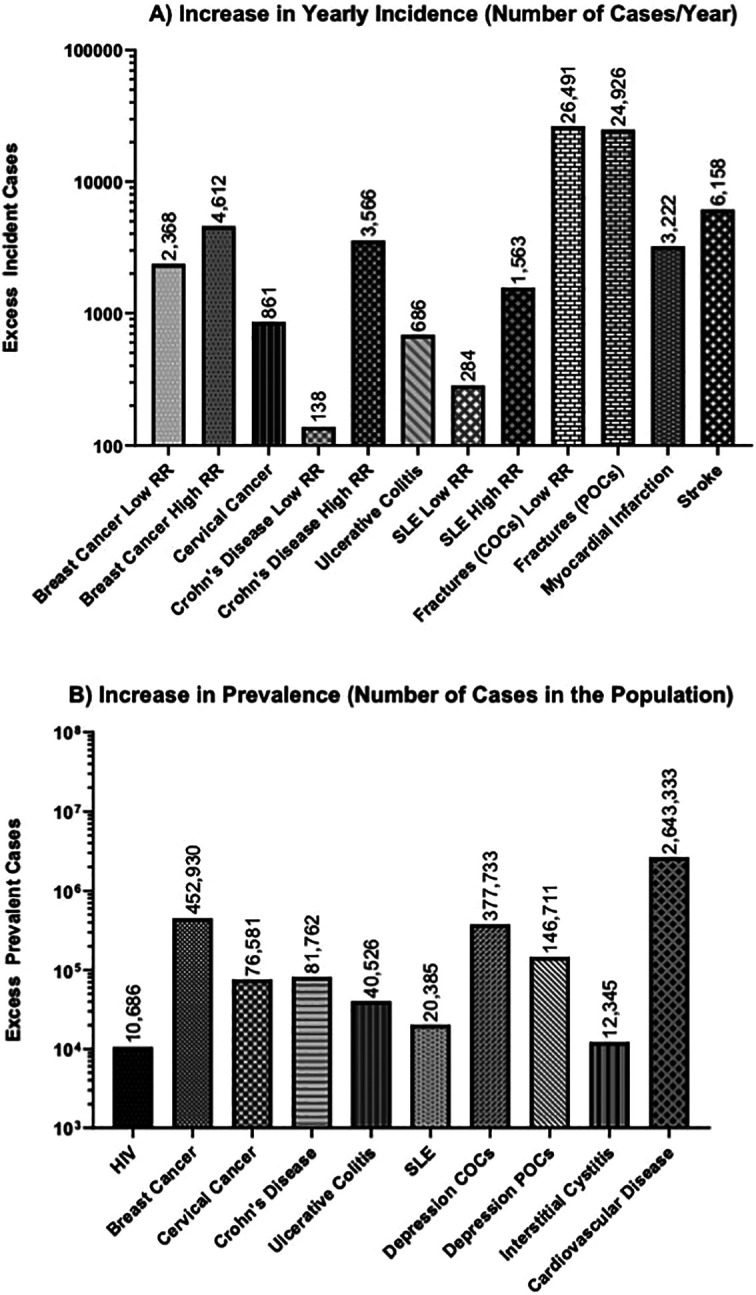
Figure 2.

Estimated increases in the yearly incidence (A) and prevalence (B) due to contraceptive use in the diseases noted. The data are derived from Tables 1–19. Where different estimates were noted, the lowest relative risk (RR) from the lowest reported disease incidence (low RR) and the highest RR from the highest reported disease incidence (high RR) are shown. Note that the y-axis for both graphs is on the log scale. Estimated numbers are shown above each bar.
