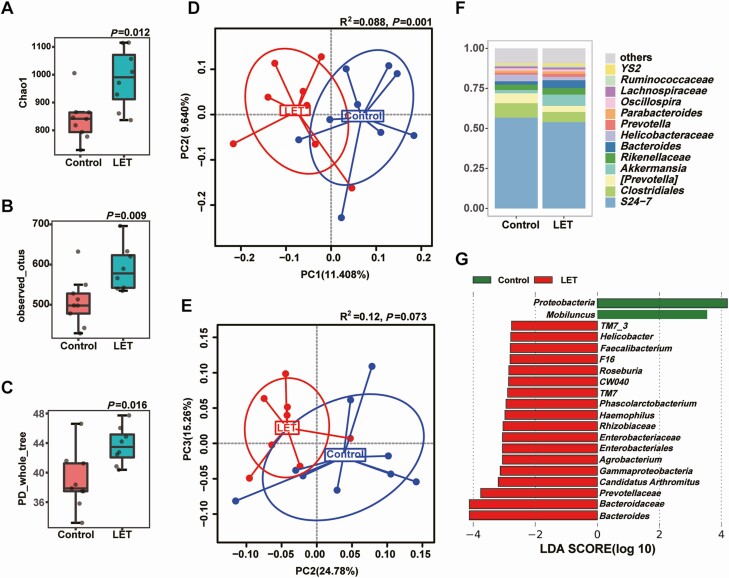
Figure 3.
Characteristics of the gut microbiota in PCOS model mice. Comparison of the stool microbiome between letrozole (LET)-induced PCOS model mice and controls (PCOS model mice: 8; controls: 9). (A-C) α-diversity of the microbiota in the feces. Data are presented as the mean ± SEM, P < 0.05, Wilcoxon rank-sum test. (D, E) Two-dimensional plot of PCoA for the microbiota. (F) The gut microbiota average relative abundance of the predominant bacterial taxa at the genus level. (G) Differentially abundant taxa identified using LEfSe analysis, P < 0.05, Kruskal-Wallis rank sum test. PCoA, principal coordinate analysis; PCOS, polycystic ovarian syndrome; SEM, standard error of the mean.

