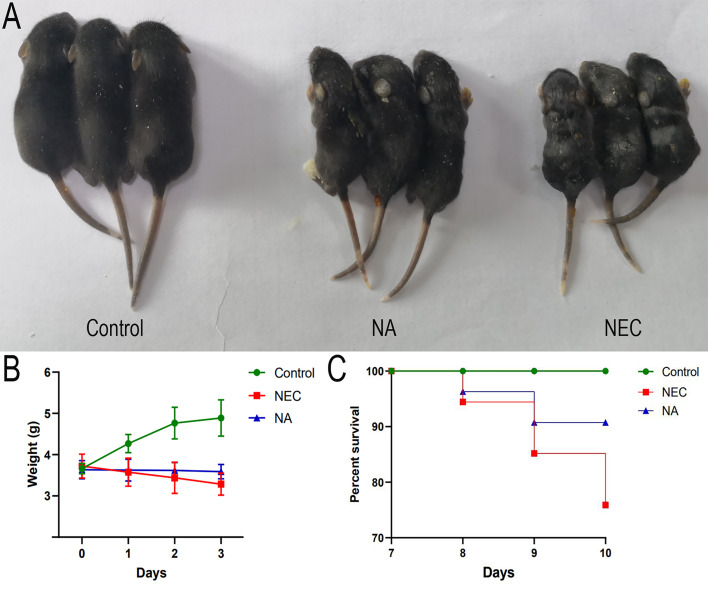
Figure 1.
(A) The growth of mice in the control group, mice in the NA group and mice in the NEC group. Mice in the NEC group were smaller than those in the control group and NA group. (B) Body weight changes of newborn mice in the three groups. Numbers of samples: Con (n=10), NEC (n=10), and NA (n=10). Statistics: two-way ANOVA multiple comparisons method. (C) Survival curves of newborn mice in three groups. The survival rate was estimated during modeling, and the results are shown as a Kaplan–Meier plot, with 54 mice in each group at the beginning. Statistics: log-rank (Mantel-Cox) test (P < 0.05). Control – normal control, NEC – necrotizing enterocolitis, NA – necrotizing enterocolitis+AI-2.

