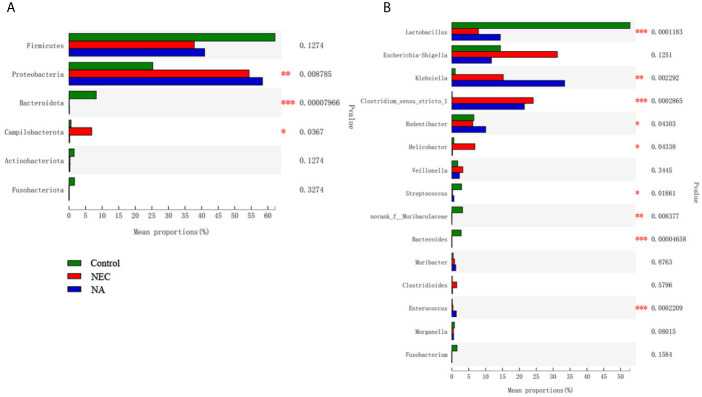
Figure 4.
(A) The flora composition of mice in the three groups at the phylum level. (B) The flora composition of mice in the three groups at the genus level. Numbers of samples: Con (n=12), NEC (n=10), and NA (n=11). Statistics: Kruskal-Wallis test with Scheffe’s post-hoc test. * 0.01 < P ≤ 0.05, ** 0.001 < P ≤ 0.01, *** P ≤ 0.001.

