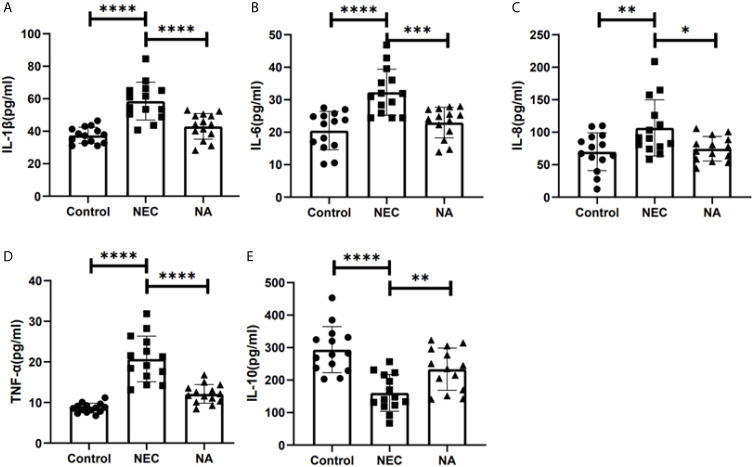
Figure 5.
The concentrations of inflammatory cytokines in the three groups were detected by ELISA. (A) The concentrations of IL-1β. (B) The concentrations of IL-6. (C) The concentrations of IL-8. (D) The concentrations of TNF-α. (E) The concentrations of IL-10. Numbers of samples: Con (n=14), NEC (n=14), and NA (n=14). Statistics: one-way ANOVA (*p < 0.05; **p < 0.01; ***p < 0.001; ****p < 0.0001).

