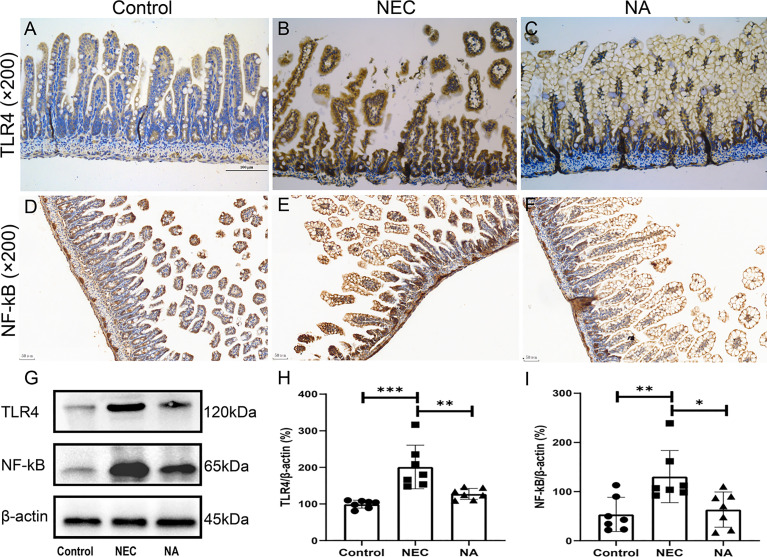
Figure 6.
(A–C) Expression of the TLR4 and NF-κB (D–F) proteins was assessed in intestinal tissues of the three groups by immunohistochemical staining. Magnification: ×200. Scale bars = 100 μm (TLR4) and 50 μm (NF-κB). Images of immunohistochemical staining of the negative control (secondary antibody and DAB control alone) are provided in Supplementary Figure 4. (G–I) Expression of the TLR4 and NF-κB proteins was determined in intestinal tissues of the three groups by western blotting. Numbers of samples: Con (n=7), NEC (n=7), and NA (n=7). Statistics: Kruskal-Wallis test *P < 0.05, **P < 0.01, ***P < 0.001.

