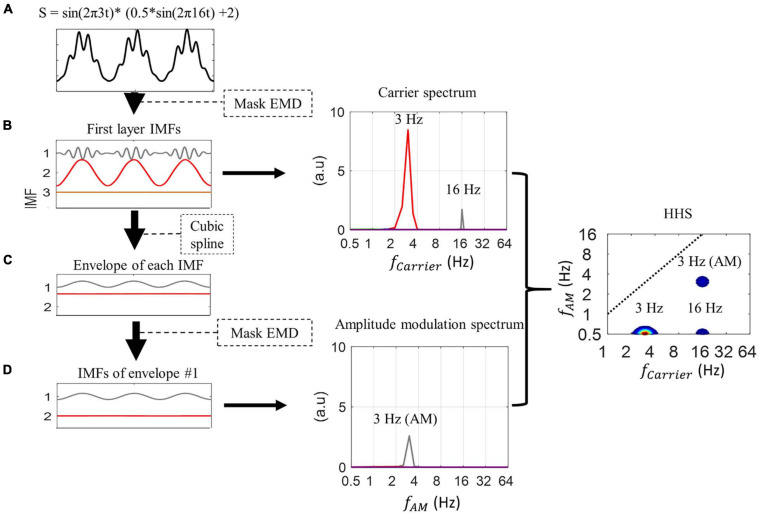
FIGURE 1.
Illustration of the process of Holo-Hilbert spectrum analysis. (A) The PAC simulated signal is decomposed into three intrinsic mode functions (IMFs) by Mask EMD to produce the first layer IMFs. (B) In this layer, IMF1 corresponds to the high-frequency signal (i.e., amplitude-modulated signal with 16 Hz signal modulated by 3 Hz, see section “Experimental Data”), while IMF2 corresponds to the low-frequency signal (3 Hz). The marginal amplitude spectrum of the first layer IMF shows amplitude peaks at 3 and 16 Hz, respectively. (C) The envelope of each IMF is extracted using cubic spline interpolation. The Mask EMD is then applied to each envelope again to acquire second layer IMFs. (D) In this case, we only illustrate the second layer IMFs of the first envelope. The amplitude modulation spectrum shows the peak amplitude of IMF1 at 3 Hz, which correspond to the 3 Hz amplitude modulation of the amplitude-modulated input signal. The carrier spectrum and amplitude modulation spectrum are combined to build the two-dimensional frequency spectrum, as known as HHS, in which the x-axis represents the carrier frequency (fc), and the y-axis represents the amplitude modulation frequency (fam). The HHS shows separate peak amplitudes at 3 Hz (at 0.5 Hz y-axis) of the sinusoidal signal, and 16 Hz (at 0.5 Hz y-axis) and 3 Hz AM of the amplitude-modulated signal. In the current study, all AM power below 0.5 Hz has been collapsed to the 0.5 Hz AM frequency bin in the HHS. The display of carrier frequencies at 0.5 Hz on the y-axis (AM frequency) might not affect the observations of higher AM frequency in the signal. The frequency axes are in dyadic scale.

