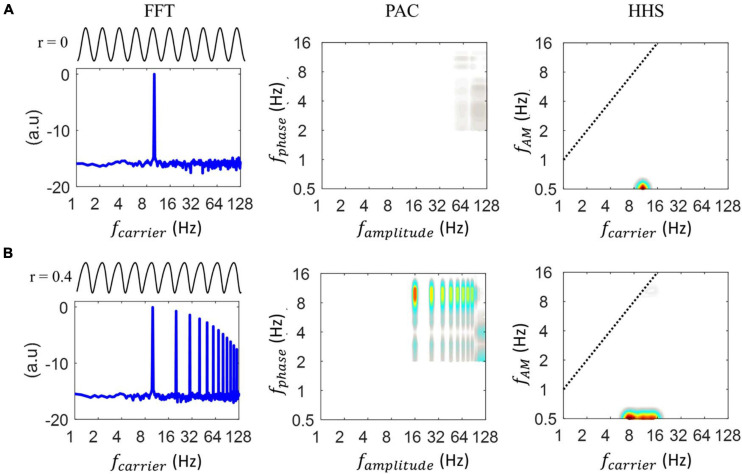
FIGURE 3.
Illustration of how the shape of the waveform alters the resulting phase-to-amplitude comodulogram for different analyses. (A) Starting from the left, the first panel shows the 10 Hz sinusoidal oscillation and its FFT. The FFT spectrum shows an amplitude at 10 Hz. Next is shown the PAC comodulogram, estimated by the Modulation Index and finally, the Holo-Hilbert spectrum of the input oscillation is shown. The latter spectrum showed an amplitude increase centered at a 10 Hz carrier without producing harmonics. (B) Starting from the left, the first panel shows the 10 Hz non-sinusoidal oscillation, which does not contain any coupling. The FFT spectrum showed an amplitude at 10 Hz and its harmonics. Next, the PAC comodulogram, estimated by Modulation Index, indicated coupling between the 10 Hz phase and 20, 40, and 128 Hz amplitudes, which are all spurious PAC couplings. The Holo-Hilbert spectrum of the input oscillation showed a wider amplitude increase centered at the 10 Hz carrier frequency without any induced harmonics.

