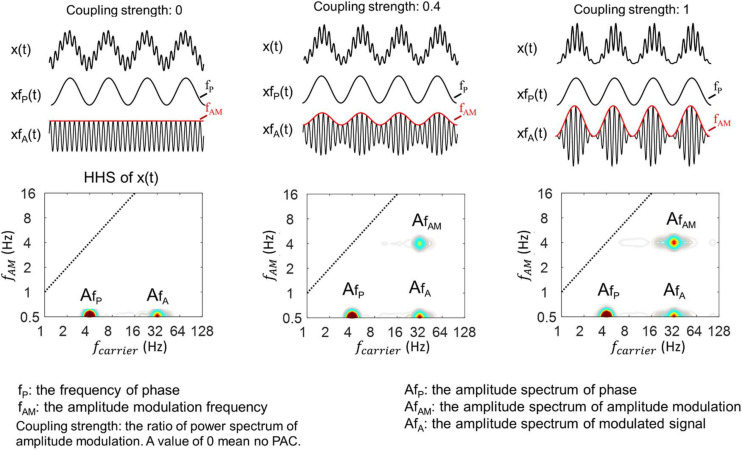
FIGURE 4.
Illustration of HHSA for synthesized data with different coupling strengths, which is the ratio of the modulation depth of xfA(t) in which x(t) = xfP(t)* xfA(t). A value of 0 indicates no modulation depth and 1 for full modulation. (Top) 3 levels differing in coupling strength (top trace) along with their corresponding HHS (bottom panels). The modulated signals with fast oscillations are plotted underneath with the amplitude envelope increasing from the top. The synthesized signals all consisted of summation of a 4 Hz sinusoidal signal and an amplitude-modulated signal with 32 Hz modulated by 4 Hz.

