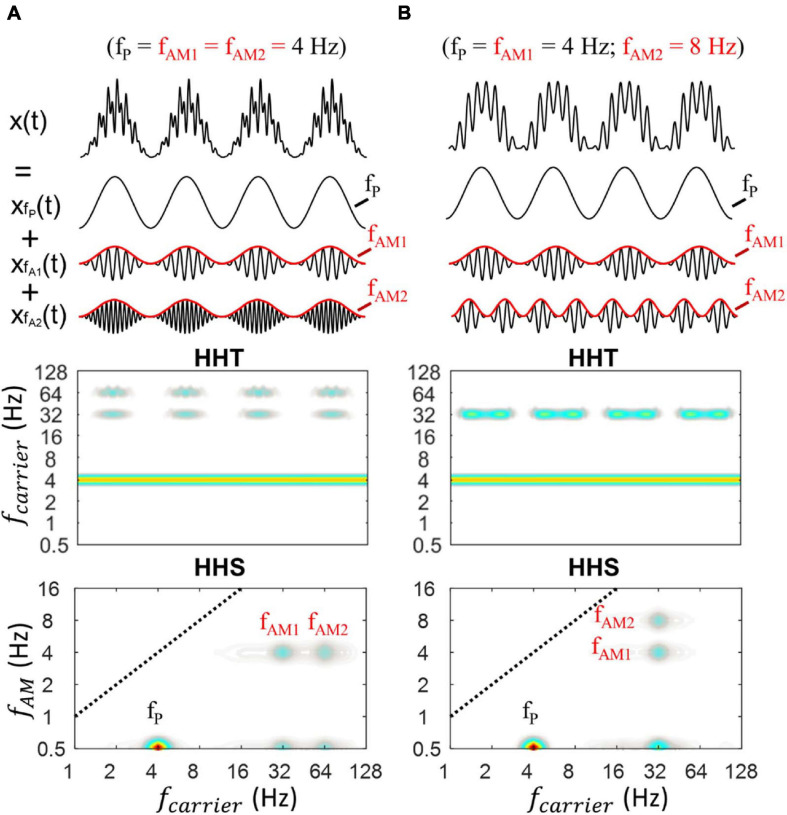
FIGURE 6.
Illustration of HHSA on a synthesized data with the sum of three oscillators (i.e., x(t) = xfP(t) + xfA1(t) + xfA2(t)). (A) The synthesized PAC data, in which theta phase was coupled with low and high gamma along with their corresponding HHT and HHS (lower panels). The HHT shows time-frequency characteristics of the simulated data, in which the amplitude increases at fP, fA1, and fA2 could be seen over time, corresponding to the original properties of the signals (amplitude modulation). The HHS shows the distinct peaks at fP, fA1, fA2, fAM1, fAM2. (B) The synthesized PAC data, in which low gamma was modulated by 4 Hz (fAM1) and 8 Hz (fAM2) along with their corresponding HHT and HHS (lower panels).

