
Figure 5.
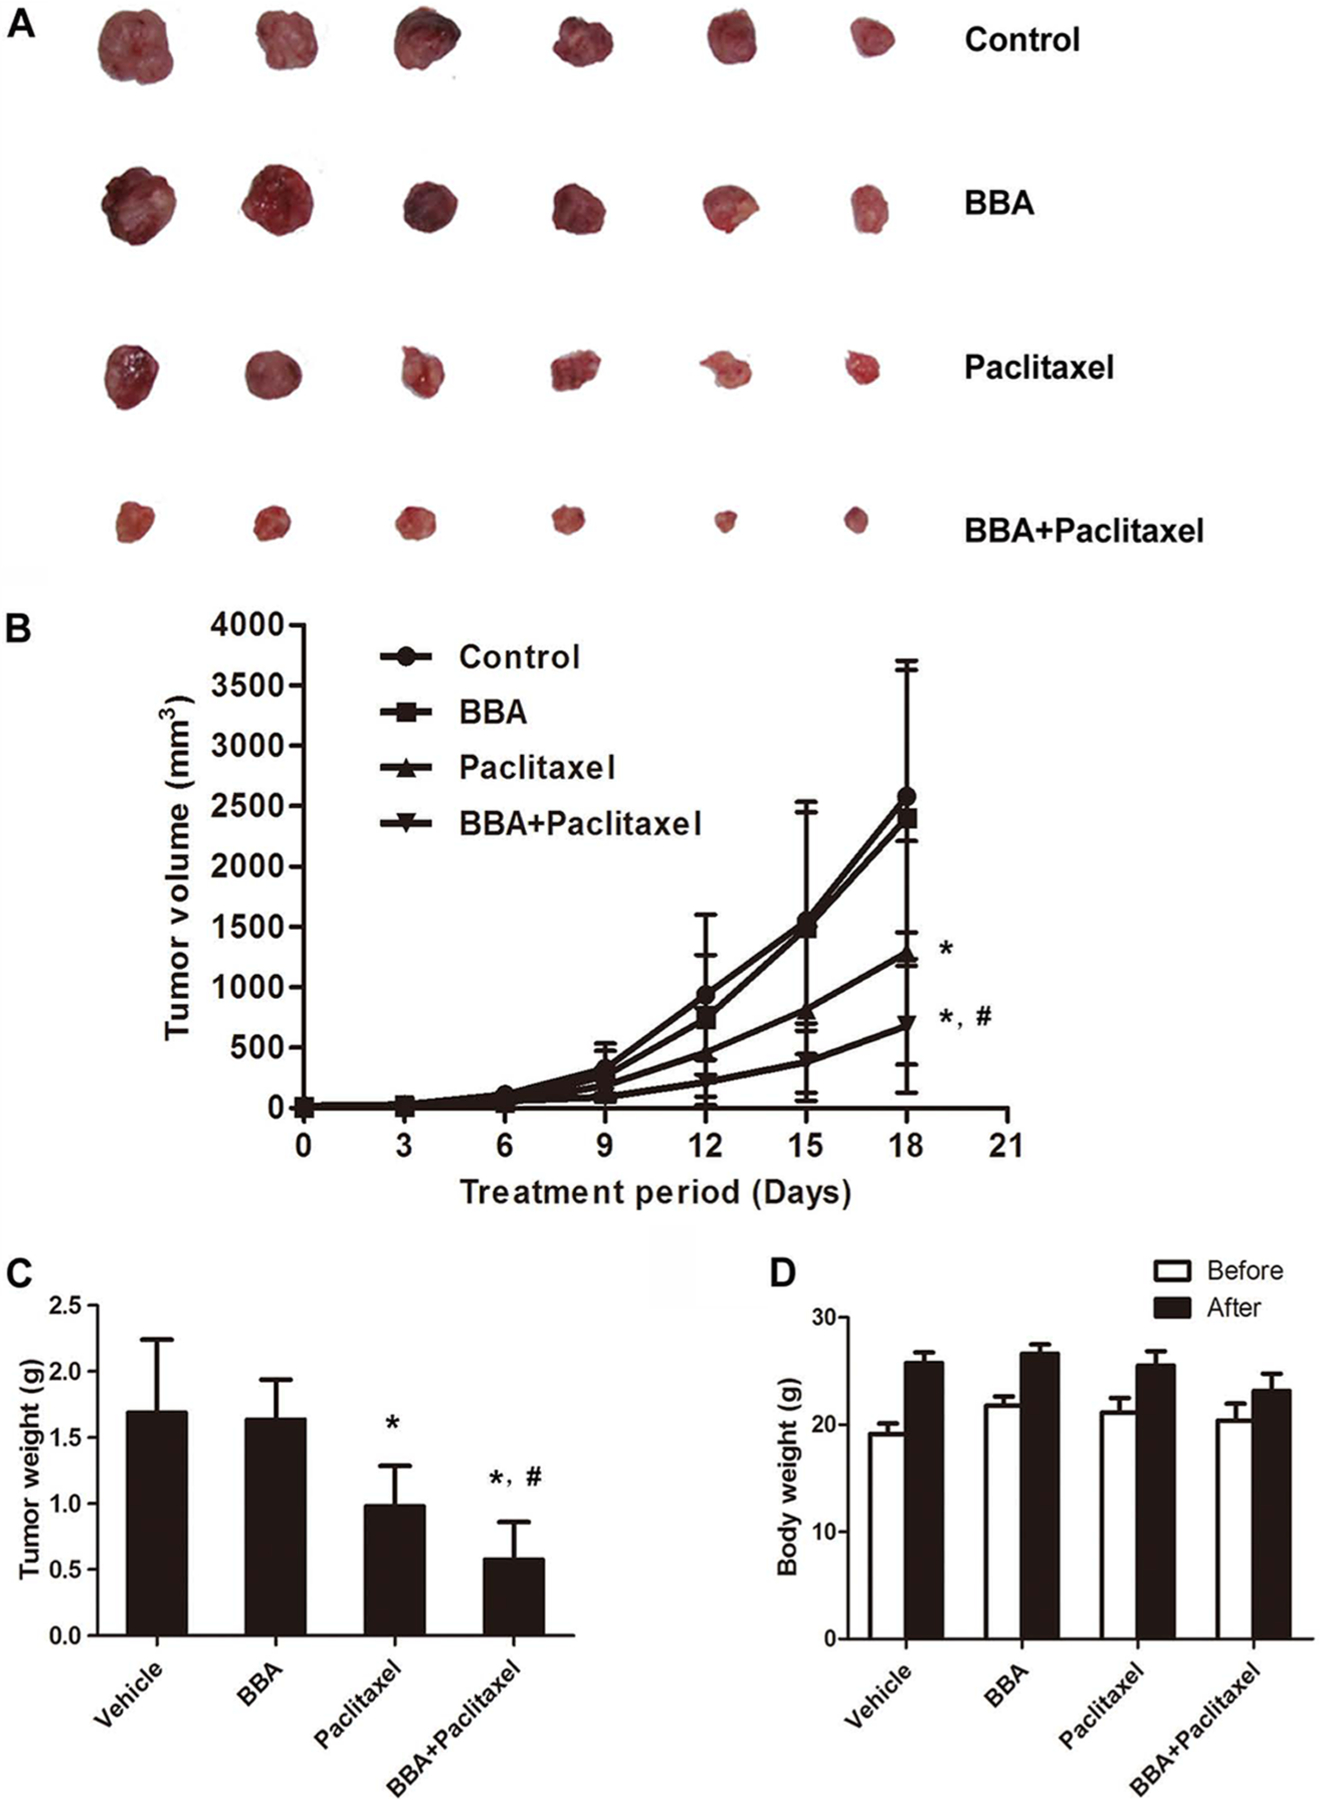
The MDR reversal effect of BBA on KB-C2 xenograft model. Potentiation of antitumor effects of paclitaxel by BBA in ABCB1 overexpressing KB-C2 xenograft model is shown. (A) A representative picture of the excised KB-C2 tumor sizes from different mice is shown on the 18th day after implantation. (B) Changes in tumor volume over the time course of the experiment in ABCB1 overexpressing KB-C2 xenograft model are shown. The treatments were as follows: (a) control (saline, q3d × 6), (b) BBA (15 mg/kg, po, q3d × 6), (c) paclitaxel (18 mg/kg, ip, q3d × 6), and (d) BBA (15 mg/kg, po, q3d × 6) + paclitaxel (18 mg/kg, ip, q3d × 6), BBA was given 2 h before paclitaxel administration. Points represent mean of tumor volume for each group (n = 6) after implantation. Each point on line graph represents the mean of tumor volume (mm3) at a particular day after implantation, and each bar represents SD. *, P < 0.05 versus the control group; #, P < 0.05 versus paclitaxel alone group. (C) The bar graph represents the mean of tumor weights (mice, n = 6) of the excised KB-C2 tumor from different mice. Each column represents the mean of determinations, and the bar represents SD. *, P < 0.05 versus the control group; #, P < 0.05 versus the paclitaxel alone group. (D) Changes in the mean of body weight over the time course of the experiment in ABCB1 overexpressing KB-C2 xenograft model are shown. One pilot study and two independent experiments were carried out using athymic (nu/nu) NCR nude mice implanted sc with KB-C2 cells. A representative result is shown.