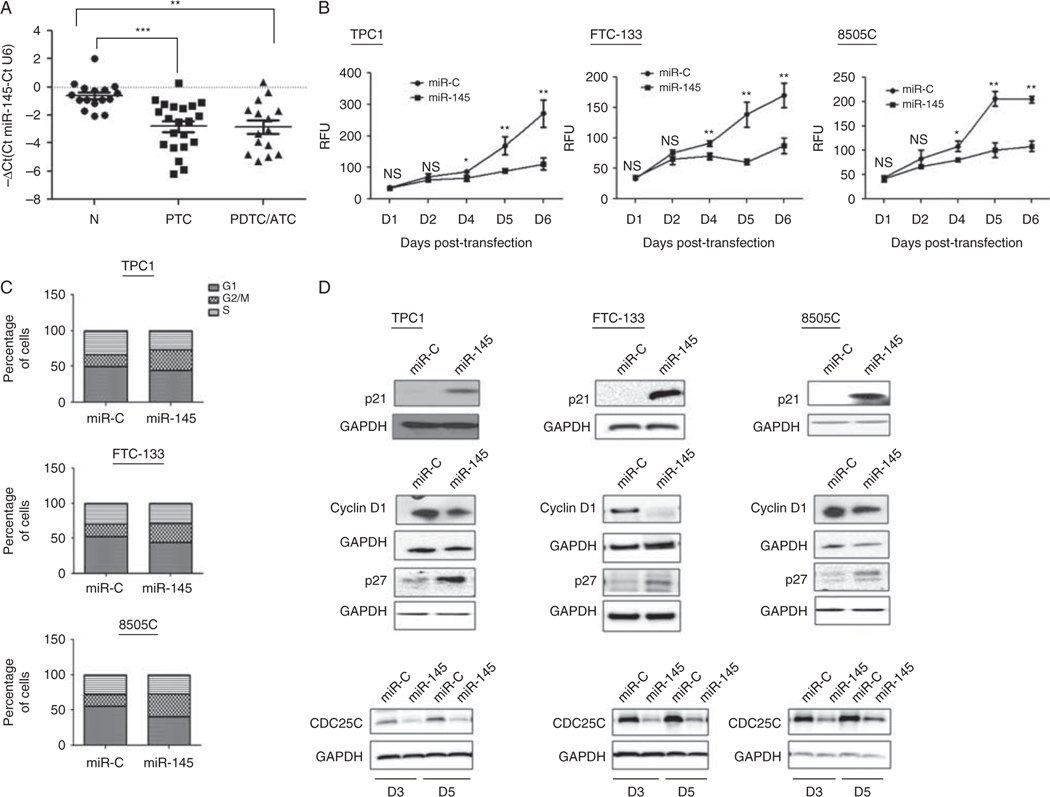
Figure 1.
Expression of miR-145 in thyroid tissue samples and thyroid cancer cell lines and the effect of miR-145 overexpression in the thyroid cancer cell lines. (A) Normalized relative expression of miR-145 by tissue type is shown in the scatter plot. 16 normal, 21 PTC, and 15 ATC/PDTC tissue samples were analyzed. miR-145 expression was significantly decreased in PTC (P=0.0001) and PDTC/ATC (P=0.0013). N, normal; PTC, papillary thyroid cancer; PDTC, poorly differentiated thyroid cancer; ATC, anaplastic thyroid cancer. ***P<0.001. (B) Cell proliferation was determined in the TPC1, FTC-133, and 8505C cell lines using Cyquant assay every 24 h after transfection with 35 nM miR-145 or miR-C. miR-145 transfection significantly inhibited cell proliferation, as compared with miR-C transfection. *P<0.05; **P<0.001. (C) Cell cycle analysis with miR-145 and miR-C transfection. G2/M arrest was increased by miR-145 overexpression. The results represent three independent experiments. (D) miR-145 modulates cell cycle regulatory proteins. Western blot analysis showed changes in cyclin D1, p21, p27, and CDC25C, consistent with G2/M arrest.

