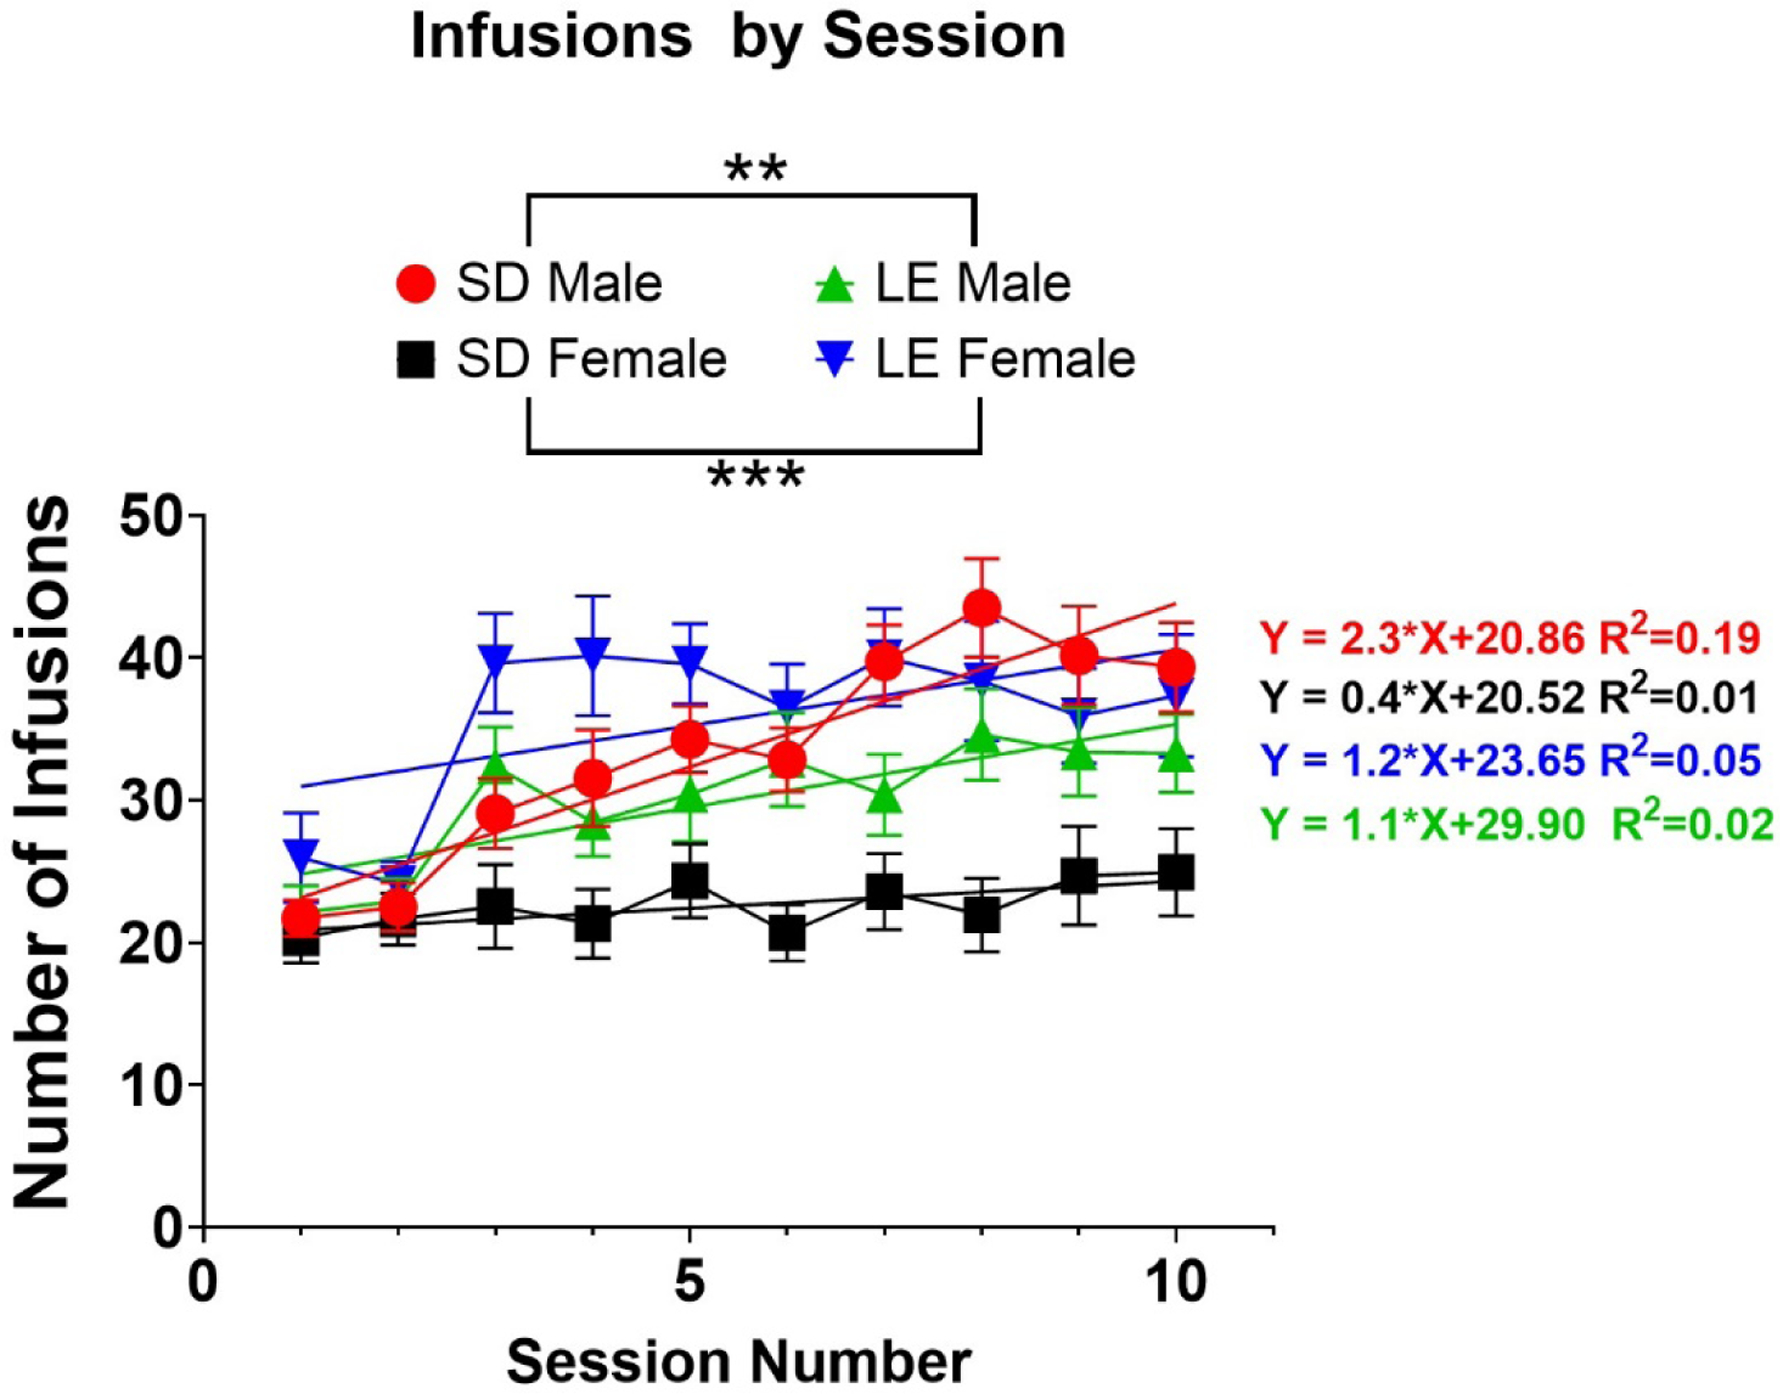
Figure 1: Differences in Infusions across Sessions is Sex and Strain Specific.

A 3-way mixed model ANOVA revealed a main effect of sex, strain and interaction. Significant effects were observed between SD males (red) and LE males (green) as well as between SD females (black) and LE females (blue). These effects are indicated by asterisks within the graph legend. Fitted linear regressions are shown for each group within the graph and respective line equations and R2 values are shown. **p<0.01; ***p<0.001. Error bars indicate ± SEM.
