
Figure 2.
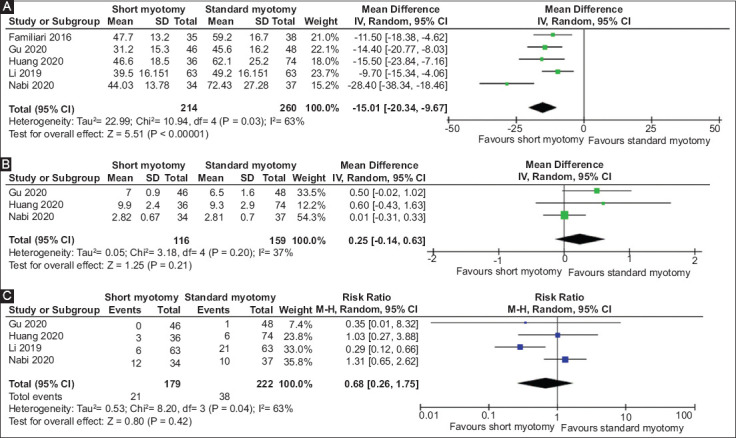
Forest plot comparing short myotomy and standard myotomy regarding perioperative outcomes. (A) Operation time. (B) Length of hospital stay. (C) Perioperative complications
CI, confidence interval
Official websites use .gov
A
.gov website belongs to an official
government organization in the United States.
Secure .gov websites use HTTPS
A lock (
) or https:// means you've safely
connected to the .gov website. Share sensitive
information only on official, secure websites.
Forest plot comparing short myotomy and standard myotomy regarding perioperative outcomes. (A) Operation time. (B) Length of hospital stay. (C) Perioperative complications
CI, confidence interval