Figure 5.
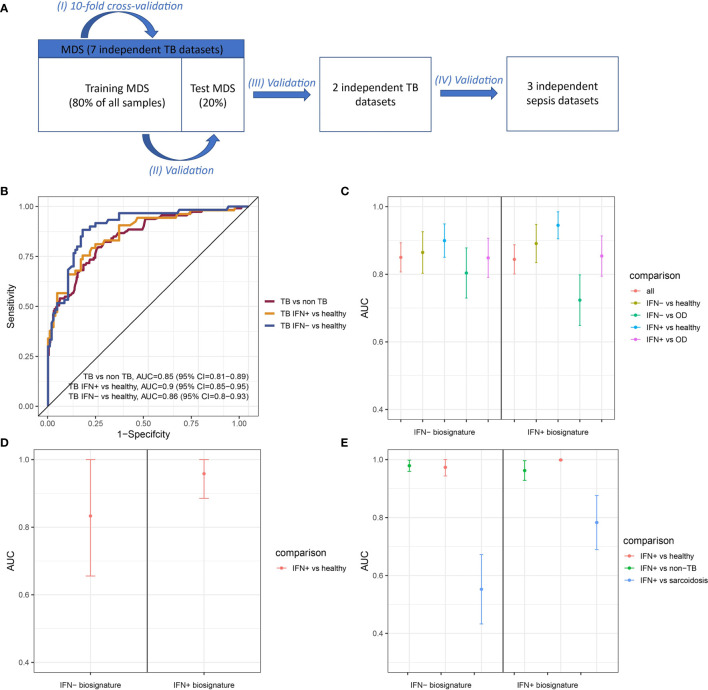
Performance of IFN+ and IFN- signatures on test and validation datasets. (A) The validation scheme. To assure the performance of the method four types of validation were used. (B) ROC curve presenting the trade-off between sensitivity and specificity of the signature derived from training set consisting of transcriptomic profiles from IFN- TB patients and non-TB controls (healthy, LTBI and OD) and tested on the test set. (C) Signatures’ performance in classifying TB patients in the test MDS containing IFN+ TB, IFN- TB, healthy and OD controls. (D) Signatures’ performance in classifying TB patients in the validation dataset from China containing only IFN+ TB patient group and healthy controls. (E) Signatures’ performance in classifying TB patients in the validation dataset derived from the samples of individuals from London, including IFN+ TB patient group, sarcoidosis patients and healthy individuals. Error bars represent 95% confidence intervals for mean value.

