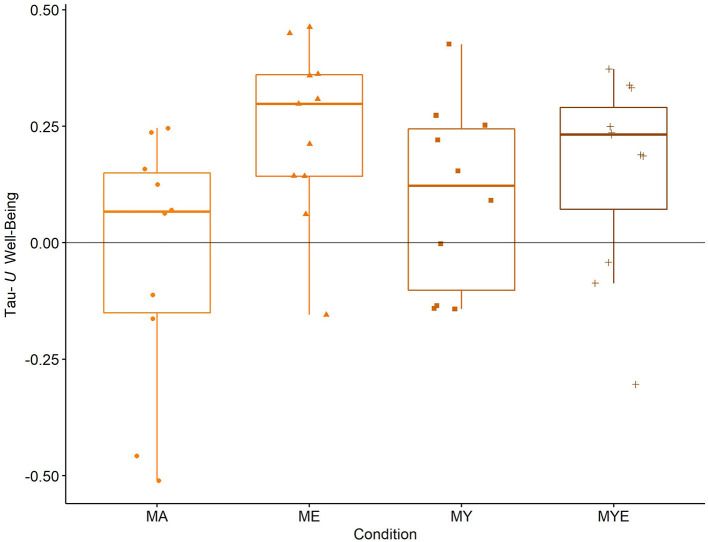
Figure 4.
Box plots for averaged Tau-U well-being estimates in each condition. Individual well-being estimates are scattered across the box plots. MA, Mantra meditation only; ME, meditation and ethical education; MY, meditation and physical yoga; MYE, meditation, physical yoga, and ethical education. Whiskers represent the largest and lowest values within a distance of 1.5 times the interquartile range.

