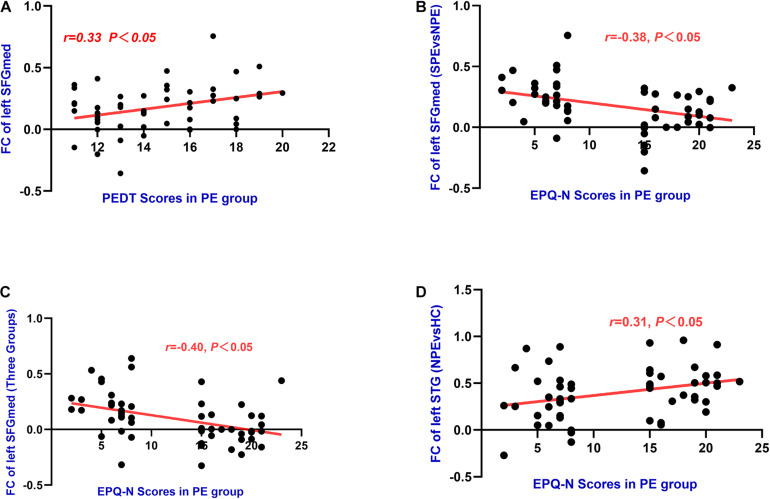
FIGURE 5.
(A) The left SFGmed (MNI: x = –9, y = 36, z = 54) had significant positive correlations with PEDT (r = 0.33, P = 0.02) in PE group. (B) The left SFGmed (MNI: x = –9, y = 36, z = 54) had negative correlations with EPQ-N scores (r = –0.38, P = 0.01) in PE group. (C) The left SFGmed (MNI: x = –9, y = 42, z = 57) had negative correlations with EPQ-N scores (r = –0.40, P = 0.00) in PE group. (D) The left STG had positive correlations with EPQ-N scores (r = 0.31, P = 0.02) in PE group.

