FIGURE 2.
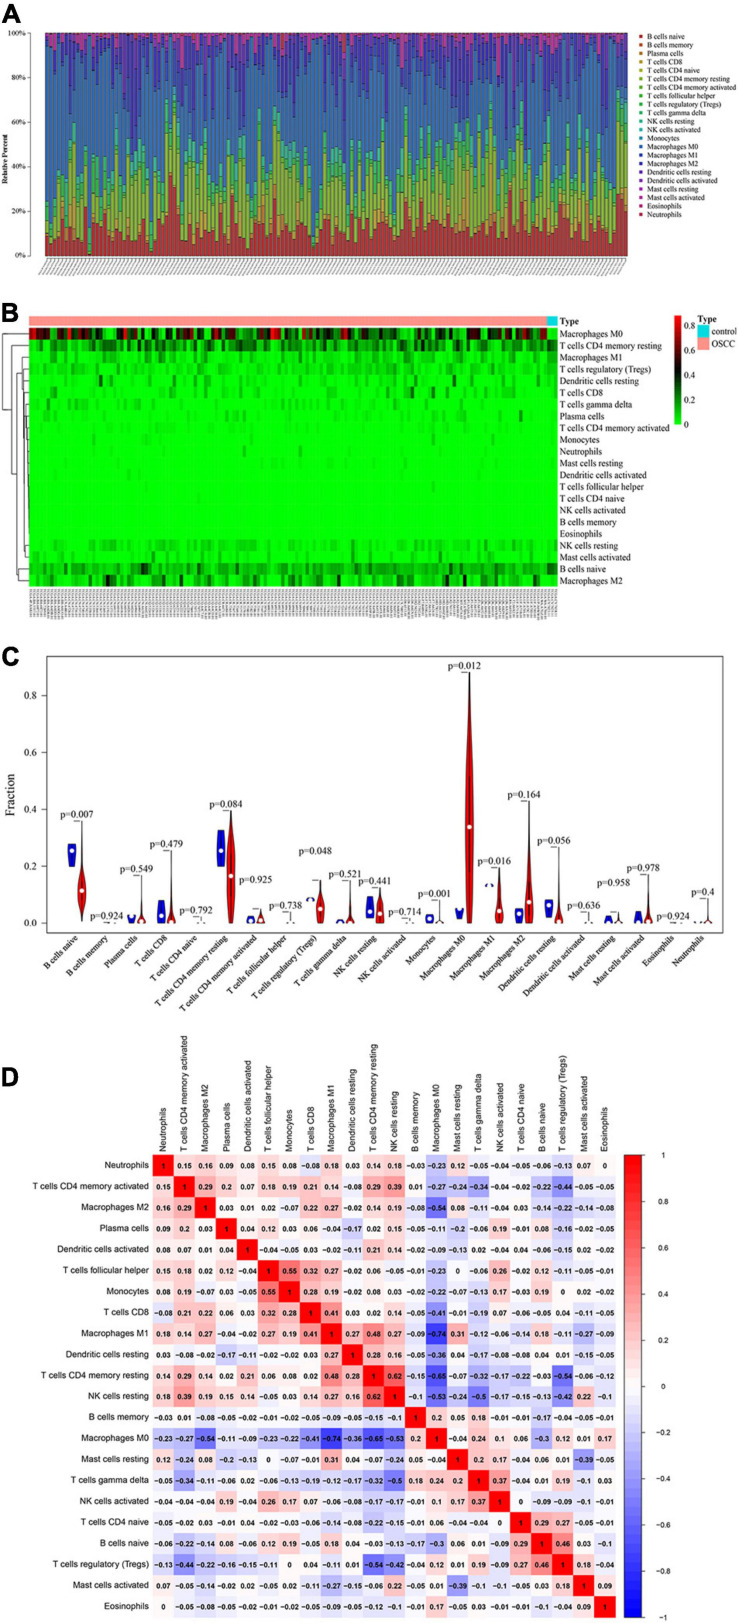
Performance of CIBERORT across TIICs in OSCC. (A) The distribution of 22 tumor-infiltrating immune cells (TIICs) in OSCC samples. The abscissa represents the name of 151 samples, and the ordinate represents the composition ratio of the cells in each sample. Different color represents different types of cells. The longer column of each cell in a certain sample indicates that the proportion of this type of cell is higher in this sample. (B) Heat map of the 22 TIICs proportions in 148 OSCC and 3 healthy control samples. Each column represents a sample, and each row represents one type of immune cell population. The levels of the immune cell populations are shown in different colors, which transition from green to red with increasing proportions. The abscissa represents the 151 samples: The pink represents the 148 OSCC samples, and the sky blue represents the 3 healthy samples. The ordinate represents the expression levels of TIICs in each sample. In the color bar, green represents the low expression of TIICs in samples, red represents the high expression of TIICs in samples, and black represents that the TIICs were not expressed in the samples, meaning the expression level was zero. (C) The differential expression status of TIICs in 151 samples. Violin plot of OSCC samples and adjacent healthy samples groups for the target cohort. Red means the OSCC samples group, and blue represents the adjacent healthy samples group; white dots indicate the average expression level of TIICs in all samples. The p-value represents the differential expression status of TIICs in OSCC samples compared with healthy samples. The abscissa represents the TIICs, and the ordinate represents the overall expression status of each TIIC in all the 151 samples. (D) Correlation matrix of 22 immune cell proportions and immune/stromal score in OSCC. Variables have been ordered by average linkage clustering. For comparison, immune/stromal score has been rescaled to range between zero and one separately in each study. The correlation between TIICs in the pathogenesis of OSCC. Both the abscissa and ordinate represent the 22 types of TIICs. The color bar shows the correlation value of TIICs. Blue means the TIICs were negatively correlated, and red means the TIICs were positively correlated. The darker color means the correlation was more significant. The diagonal line drawn from coordinate (0,22) to coordinate (22,0) has a correlation of 1.

