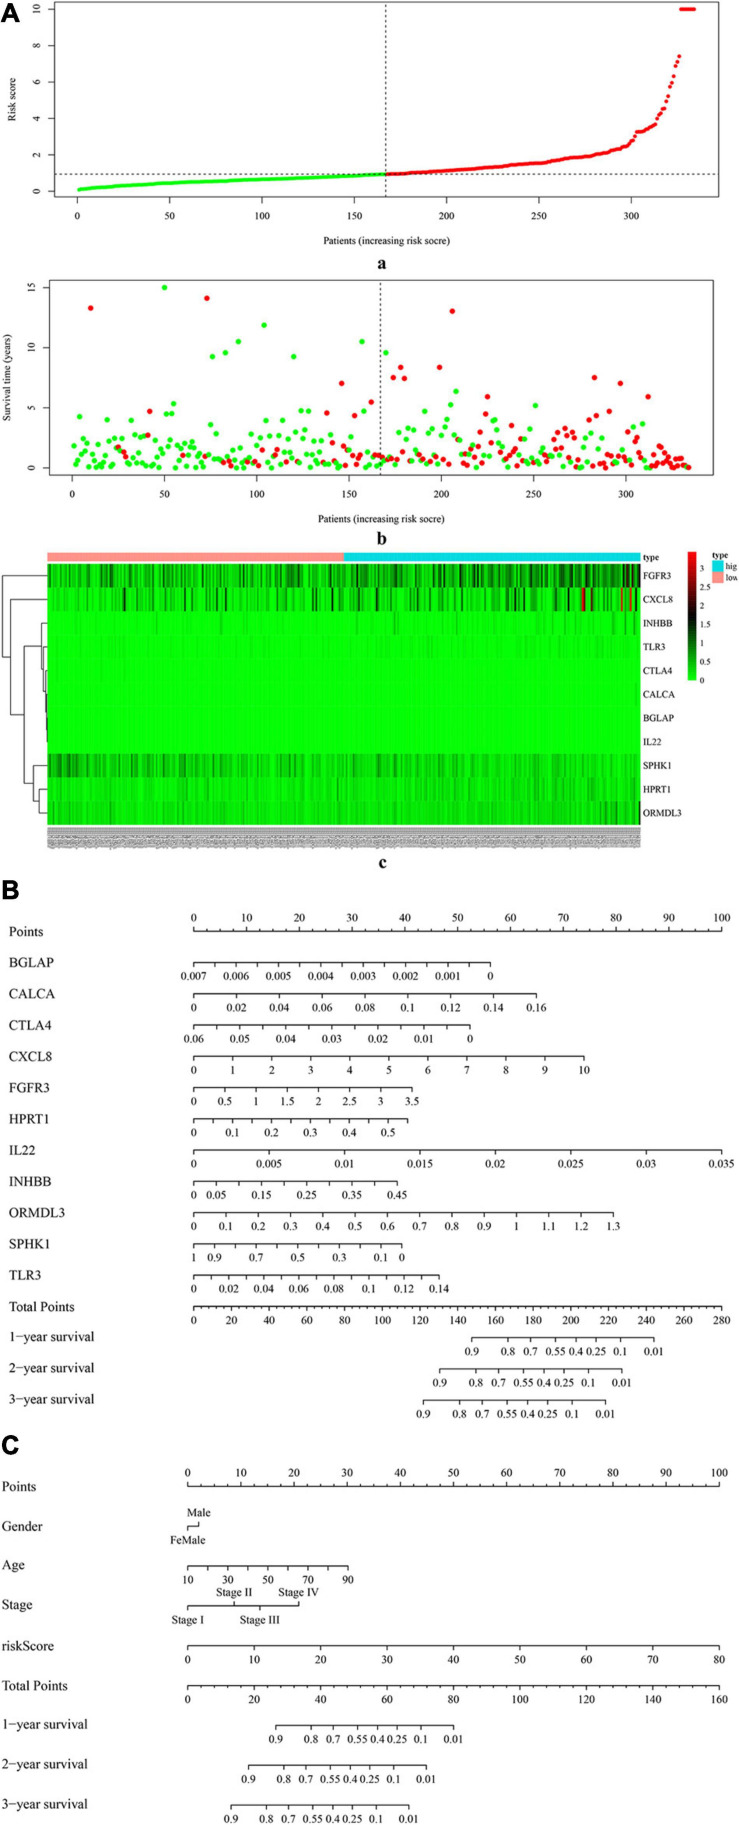
FIGURE 4.
The correlation between 11 risk ISGs and survival of OSCC. (A) Prognostic risk score model analysis of 11 risk ISGs in OSCC patients. (a) The distribution of the risk scores in the OSCC sample. The x-axis represents the sample number of OSCC samples; the y-axis represents the risk score corresponding to the sample number. The green part of the curve that is lower than the median value represents the comparatively lower risk of survival, and the red part of the curve that is higher than the median value represents the higher risk of survival. (b) The distribution of patients’ survival status in the OSCC sample. The graph is drawn based on whether the final state of each OSCC patient during the follow-up period is alive or dead. The abscissa represents the risk score of OSCC patients, and the ordinate represents survival time. Each dot represents an OSCC patient: the red dot represents that the OSCC patient is dead at the final day of follow-up period, whereas the green dot represents that the OSCC patients is still alive at the final day of follow-up period. (c) The 11 risk ISGs expression profiles of patients in the low- and high-risk groups of OSCC samples. Each column represents a OSCC sample, and each row represents the expression profile of each gene within the 11 risk ISGs. The expression levels of the 11 risk ISGs in OSCC samples are shown in different colors, which transition from green to red. The abscissa represents the 148 OSCC samples: pink represents the OSCC samples with low risk of survival, and sky blue represents the OSCC samples with the high risk of survival. The ordinate represents the expression levels of TIICs in each OSCC sample. In the color bar, green represents the low expression of 11 ISGs in samples, red represents the high expression of 11 ISGs in samples, and black represents that the ISGs were not expressed in the OSCC samples, meaning the expression level was zero. (B) Nomogram for predicting 1-, 2-, and 3-year probabilities of overall survival in OSCC patients according to the expression level of 11 risk ISGs. The total score was 0–280. Total score of an individual patient is calculated and merged based on each variable. A high score indicates a high risk of survival. A line is drawn upward to determine the score received for each variable value. The sum of these scores is located on the total points axis; then, a line is drawn downward to the survival axes to determine the likelihood of 1-, 2-, or 3-year overall survival. (C) Nomogram for predicting 1-, 2-, and 3-year probabilities of overall survival in OSCC patients according to the risk score as well as clinical characteristics of samples (e.g., gender, age, and pathological stage). Total score was 0–160. Total score of an individual patient is calculated and merged based on each variable. A high score indicates a high risk of survival. A line is drawn upward to determine the score received for each variable value. The sum of these scores is located on the total points axis; then, a line is drawn downward to the survival axes to determine the likelihood of 1-, 2-, or 3-year overall survival.

