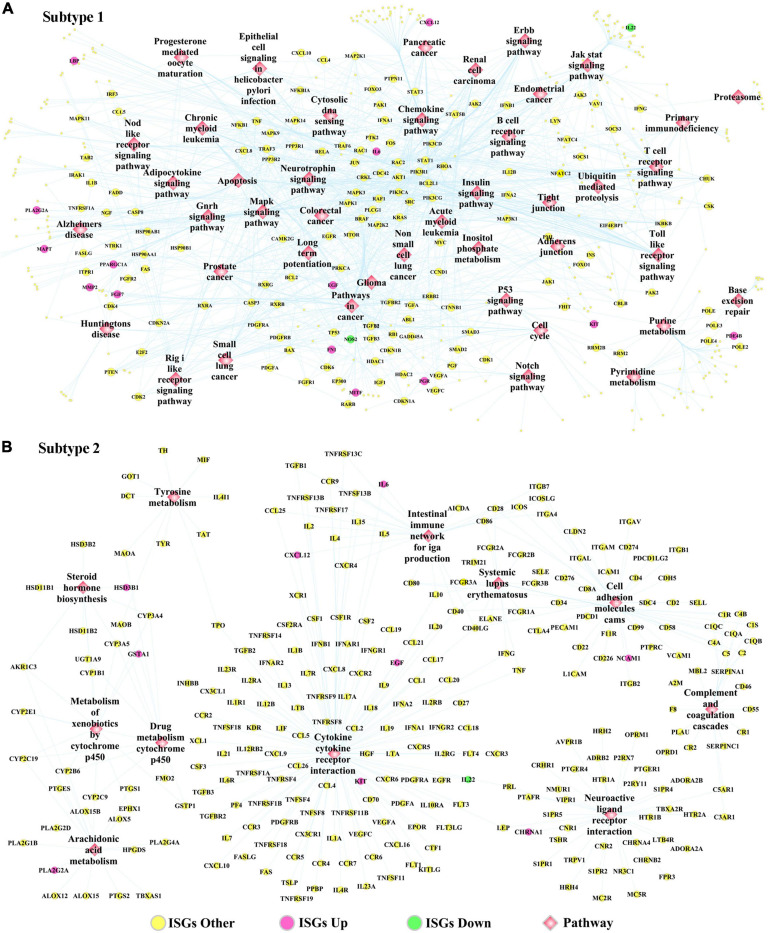
FIGURE 6.
The ISGs-pathways interaction network in OSCC samples of panel (A) subtype Sub1 and panel (B) subtype Sub2. The rose-red round nodes represent ISGs that were DEGs upregulated between two subtypes of OSCC, the emerald round nodes represent ISGs that were also DEGs downregulated between two subtypes of OSCC, the yellow round nodes represent ISGs that were not DEGs dysregulated between two subtypes of OSCC, and the diamond nodes represent the signaling pathways targeted by ISGs.

