Figure 1.

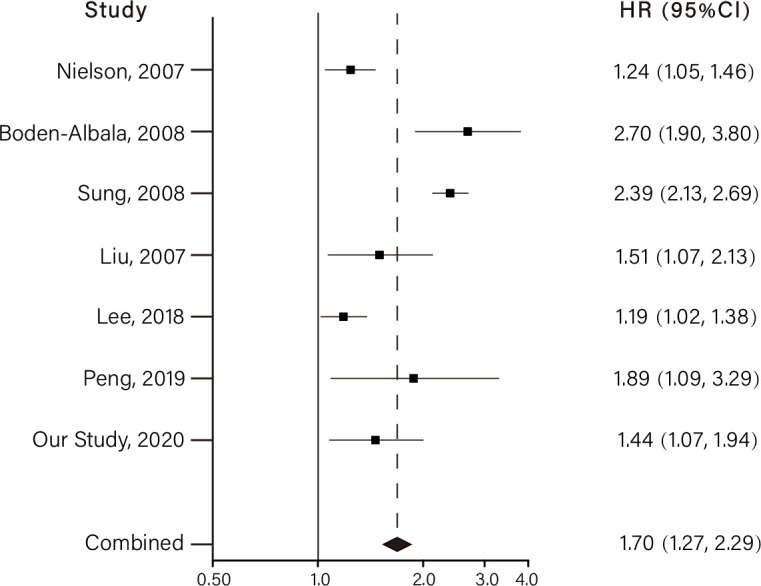
Meta-analysis of fasting blood glucose at the highest vs lowest levels and the risk of developing stroke. The horizontal lines indicate the lower and upper limits of the 95% CI, and the grey squares reflect the HR of each study.

Meta-analysis of fasting blood glucose at the highest vs lowest levels and the risk of developing stroke. The horizontal lines indicate the lower and upper limits of the 95% CI, and the grey squares reflect the HR of each study.