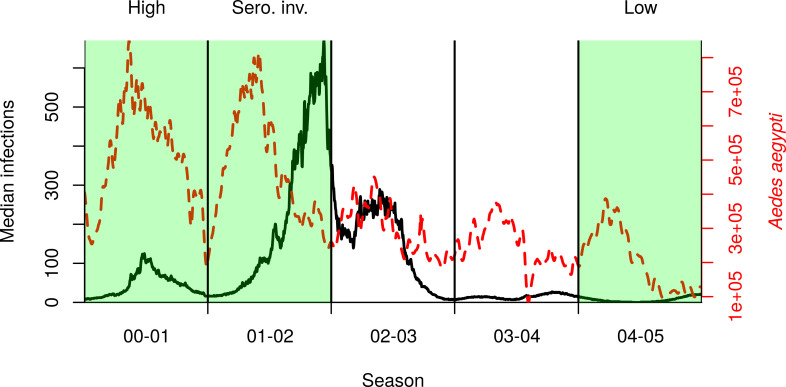
Fig 1. Median incidence of DENV infections (black solid line) and total mosquito abundance (dashed red line) in our reconstruction of dengue virus transmission during 2000–2005 in Iquitos.
Vertical lines delineate transmission seasons, defined as beginning on July 1. Highlighted in green are three seasons in which we initiated lockdown, chosen to represent a range of possible epidemiological scenarios.

