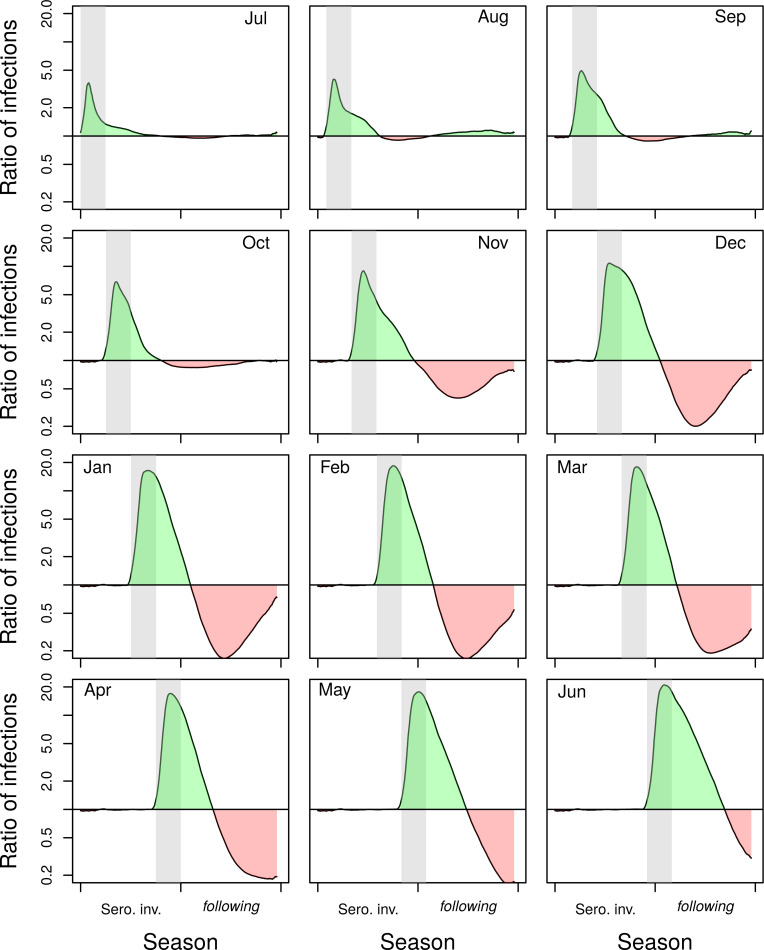
Fig 4. Ratio of the mean number of infections under lockdown without vector control to the mean number in the baseline scenario without lockdown but with vector control.
Results are for the serotype invasion and following season, when lockdown is initiated in different months (shown in the top corner of the panel). When lockdown did not occur, there was a city-wide vector control campaign. Conversely, when lockdown did occur, there was no vector control campaign. Lockdown/vector control occurred during the gray band. Green shading indicates an increase in infections under lockdown without vector control, whereas red shading indicates a decrease.

