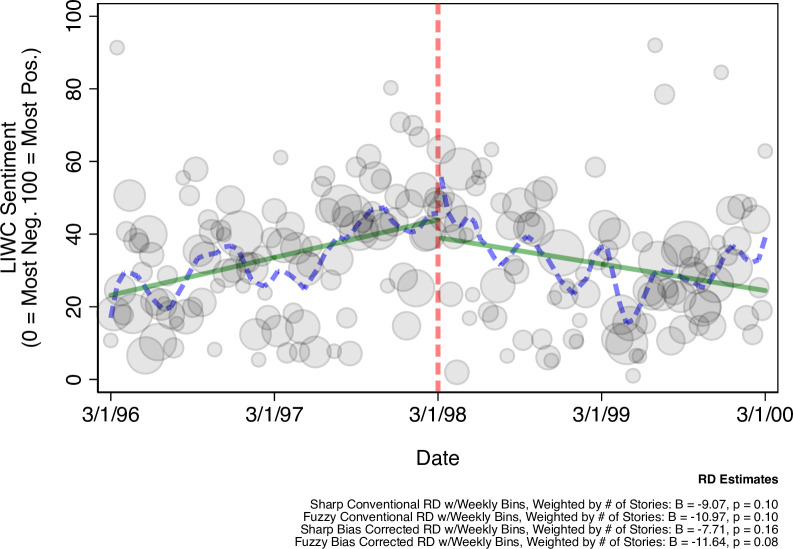
Fig 2. MMR news sentiment pre/post AW98 (weighted by volume).
Figure presents weekly sentiment ratings of vaccine-related stories from major news outlets (gray shaded circles), weighted by the total amount of stories published that week (larger when there is more coverage in a given week). The figure also reports the effect (B) and two-tailed significance (p) of AW98 on weekly report counts before/after AW98 (dashed vertical line), across several RD estimation strategies (see: Materials & Methods). All RD estimates are calculated as linear effects; which is appropriate given the high degree of consonance between the locally weighted polynomial trend line (dashed lines) and linear trend line (solid line) fit to the weekly data; both of which adjust for total volume. N = 674 stories.

