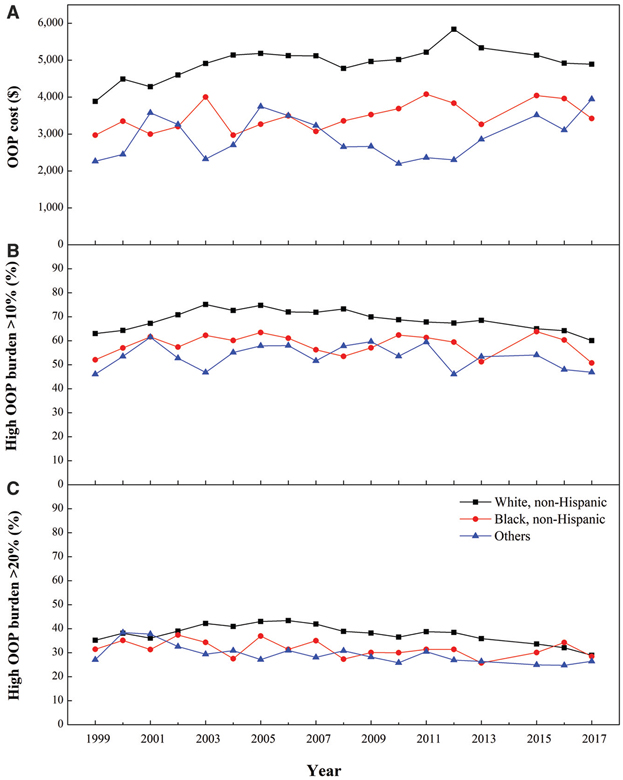
Figure 3—
Mean annual total OOP costs and prevalence of high OOP burden (>10% and >20% of pretax income) by race/ethnicity among Medicare beneficiaries with diabetes (≥65 years old), 1999 – 2017. A: Mean annual total OOP costs (2017 USD) by race/ethnicity. B: Percentage prevalence of beneficiaries with high OOP burden that exceeded 10% of their pretax income by race/ethnicity. C: Percentage prevalence of beneficiaries with high OOP burden that exceeded 20% of their pretax income by race/ethnicity.

