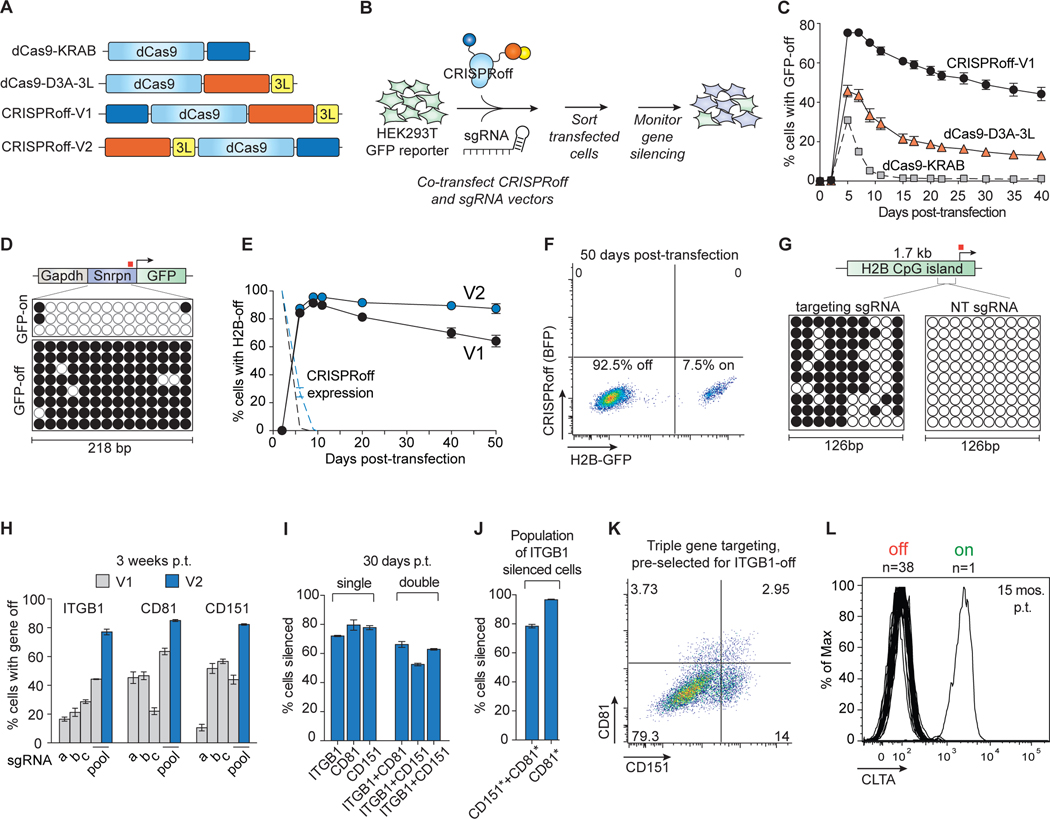
Figure 1. Durable and multiplexed gene silencing by CRISPRoff.
(A) A schematic of dCas9 epigenetic editor fusion proteins that were tested for gene silencing activity. 3L denotes Dnmt3L.
(B) Plasmids encoding dCas9 fusions and sgRNAs were co-transfected into HEK293T cells stably expressing a DNA methylation-sensitive Snrpn-GFP reporter. Transfected cells were sorted 2 days after transfection and GFP silencing was monitored over time.
(C) A time course comparing GFP silencing activities of CRISPRoff-V1, dCas9–3A-3L, and dCas9-KRAB.
(D) Bisulfite PCR analysis of the Snrpn locus before or after CRISPRoff targeting. The white circles indicate unmethylated CpG dinucleotides and black circles represent methylated CpG dinucleotides. Each row represents one sequencing read. The red square denotes the sgRNA binding site.
(E) A comparison of CRISPRoff-V1 (black) and CRISPRoff-V2 (blue) editors in silencing the endogenously GFP-tagged H2B gene. The dotted lines represent protein expression of CRISPRoff-V1 and -V2.
(F) A representative flow cytometry plot of H2B-GFP expression of cells at 50 days post-transfection of CRISPRoff V2.
(G) Bisulfite sequencing analysis of a 126 bp region of the H2B CpG island. The red square denotes the sgRNA binding site.
(H) Quantification of cells with ITGB1, CD81, or CD151 silenced 3 weeks post-transfection (p.t.) of CRISPRoff-V1 or -V2 with individual sgRNAs (a-c) or a pool of three sgRNAs (a, b, c).
(I) Quantification of cells with ITGB1, CD81, CD151 silenced 30 days p.t. from single or double gene targeting experiments.
(J) Quantification of multiplexed triple gene silencing by either gating on ITGB1-off cells then gating for CD81- and CD151-off cells (left bar) or by first gating on ITGB1-off cells, then CD151-off cells, and finally CD81-off cells (right bar). The asterisks denote the population of cells with the marked gene turned off.
(K) A representative flow cytometry plot of cells targeted for ITGB1, CD81, and CD151 silencing. Cells were first gated on ITGB1 silencing and the represented population displays CD81 and CD151 silencing.
(L) A histogram plot of CLTA expression at 15 months p.t. showing 38 clones that retained CLTA repression and one clone that reactivated CLTA expression.
The mean values in C, E, H-J were measured from three independent experiments. Error bars represent SD of the mean.

