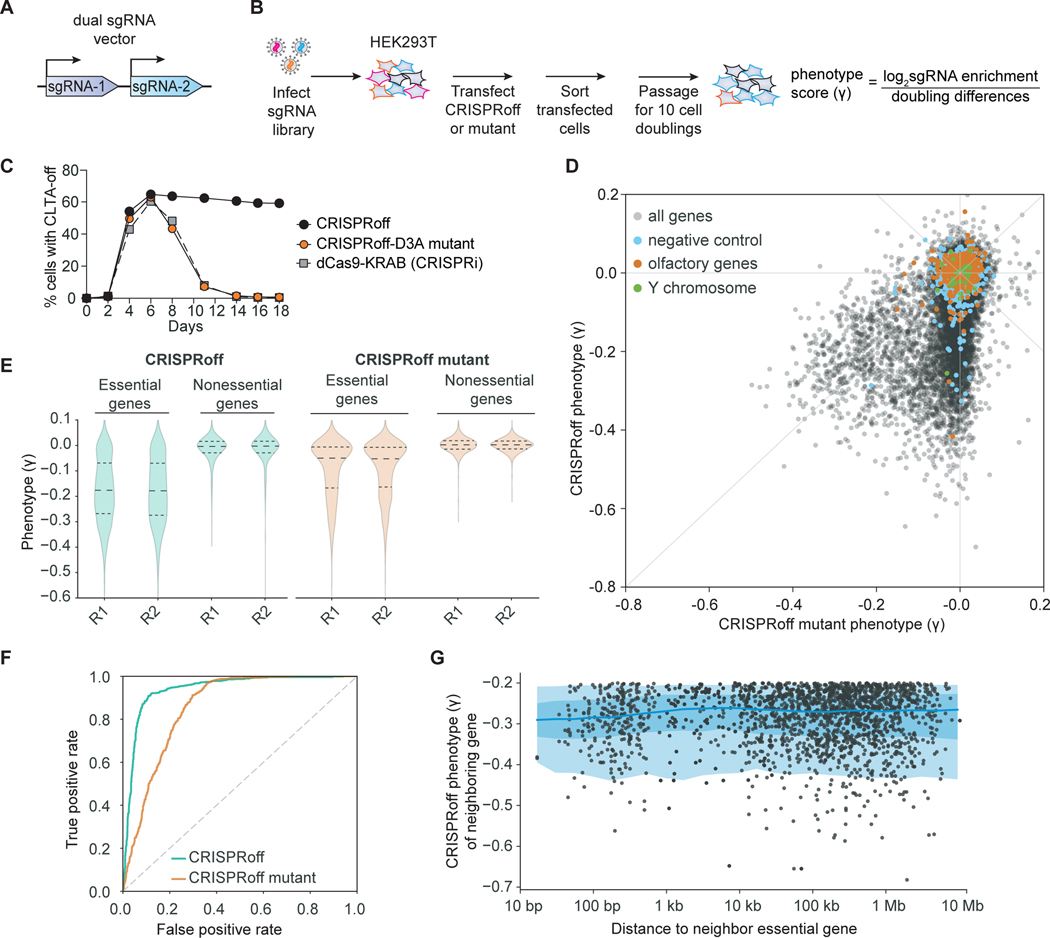
Figure 4. Genome-wide gene silencing by CRISPRoff.
(A) A schematic of the dual sgRNA lentiviral vector used in the CRISPRoff genome-wide screens that contains two unique sgRNAs targeting the same gene.
(B) A schematic of a pooled genome-wide screen to determine the targeting landscape of CRISPRoff.
(C) A time course of CLTA expression in HEK293T after transfection of dCas9-KRAB (gray), CRISPRoff-V2 (black), or mutant CRISPRoff-D3AE765A (orange).
(D) A comparison of phenotype scores (γ) between CRISPRoff (y-axis) and CRISPRoff mutant (x-axis) screens. Three types of expected negative controls are highlighted as negative control pseudo-genes (blue), olfactory genes (orange), and Y chromosome genes (green).
(E) A violin plot of the phenotype scores (γ) for genes defined as essential or nonessential from DepMap. Each replicate screen is plotted for CRISPRoff (green) and CRISPRoff mutant (orange).
(F) A plot of true and false positive rates of genes defined as essential by DepMap.
(G) A plot illustrating the distance of an essential gene hit, defined as having a γ ≤ −0.2, from the nearest essential gene hit. Each dot corresponds to a gene hit’s nearest neighboring essential gene, with the x-axis showing the distance between the two genes and the y-axis as the neighboring gene’s phenotype score.

