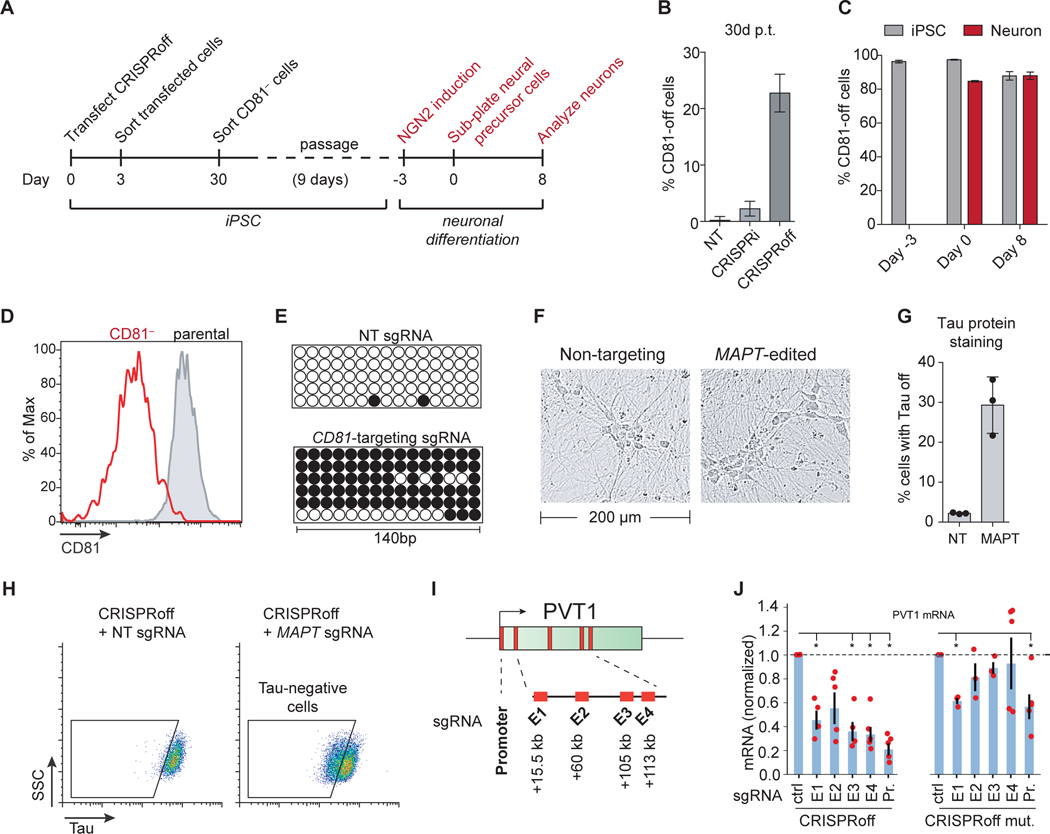
Figure 7. CRISPRoff gene silencing in iPSCs, iPSC-derived neurons, and enhancers.
(A) An experimental workflow of CD81 knockdown by CRISPRoff in iPSCs, followed by NGN2-mediated differentiation of edited cells into neurons.
(B) Quantification of cells with CD81 silenced by CRISPRi or CRISPRoff with CD81-targeting or NT sgRNAs, measured at 30 days p.t. The error bars represent SD from three independent experiments.
(C) Quantification of cells with CD81 silenced at the indicated time points from (A). The gray bars indicate the percent of iPSC-edited cells with CD81 silenced that were not differentiated during the experiment. The red bars represent cells that were carried through the neuronal differentiation protocol. The error bars represent SD from three independent experiments.
(D) A representative histogram of CD81 expression at days 8 of neuronal differentiation of parental-unedited (gray) or CD81-edited iPSCs (red).
(E) Bisulfite PCR of a 140 bp region of the CD81 promoter in cells transfected with CRISPRoff and NT or CD81-targeting sgRNA.
(F) Representative bright field microscopy images of differentiated neurons derived from iPSCs transfected with CRISPRoff and MAPT-targeting or NT sgRNA.
(G) Quantification of cells with Tau-off in cells transfected with CRISPRoff and NT or MAPT-targeting sgRNA, measured at 10 days post-differentiation.
(H) Representative flow cytometry plots of Tau protein staining in iPSC-derived neurons after CRISPRoff transfection with NT or MAPT-targeting sgRNA. The gates are based on unperturbed iPSC-derived neurons.
(I) A schematic of the PVT1 locus with the promoter and four enhancer elements (E1-E4) labeled with the distance from the TSS.
(J) Plots of normalized PVT1 transcript levels from quantitative RT-qPCR of cells treated with CRISPRoff (left) or CRISPRoff D3A mutant (right) and sgRNAs targeting either the promoter (Pr.) or the four enhancer elements (E1-E4), normalized to control sgRNAs. Asterisks denote statistical significance by t-test and each technical replicate is shown as red dots.

