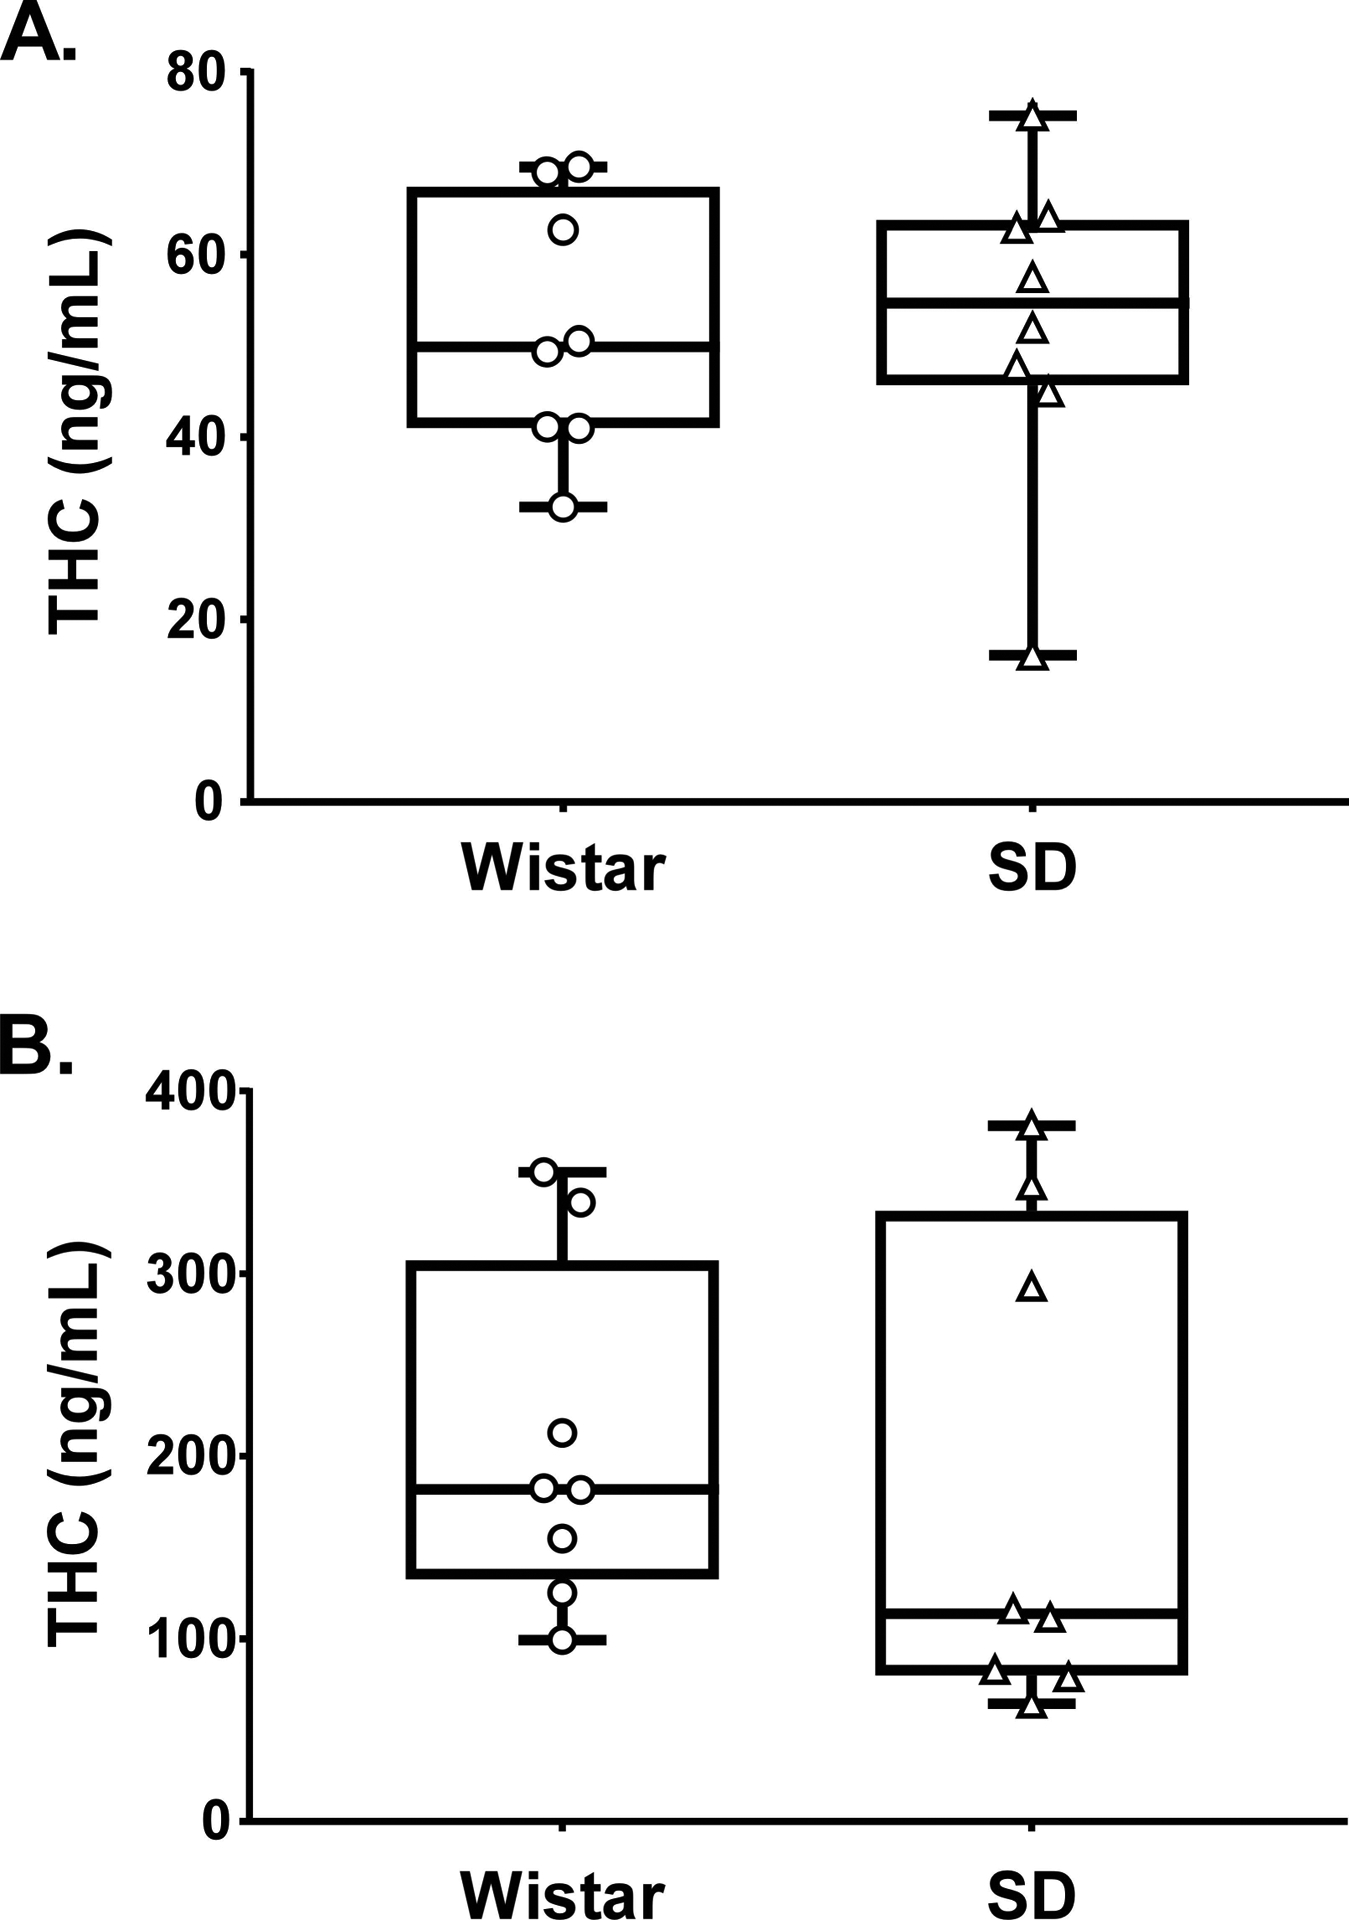
Figure 3:

Plasma THC concentrations for Wistar and Sprague-Dawley rats (N=8 / group) following vapor inhalation of the THC (100 mg/mL) for 30 minutes at A) 13 and B) 25 weeks of age. Box plots depict median and interquartile range and the bars indicate the range. Individual subject values are also plotted.
