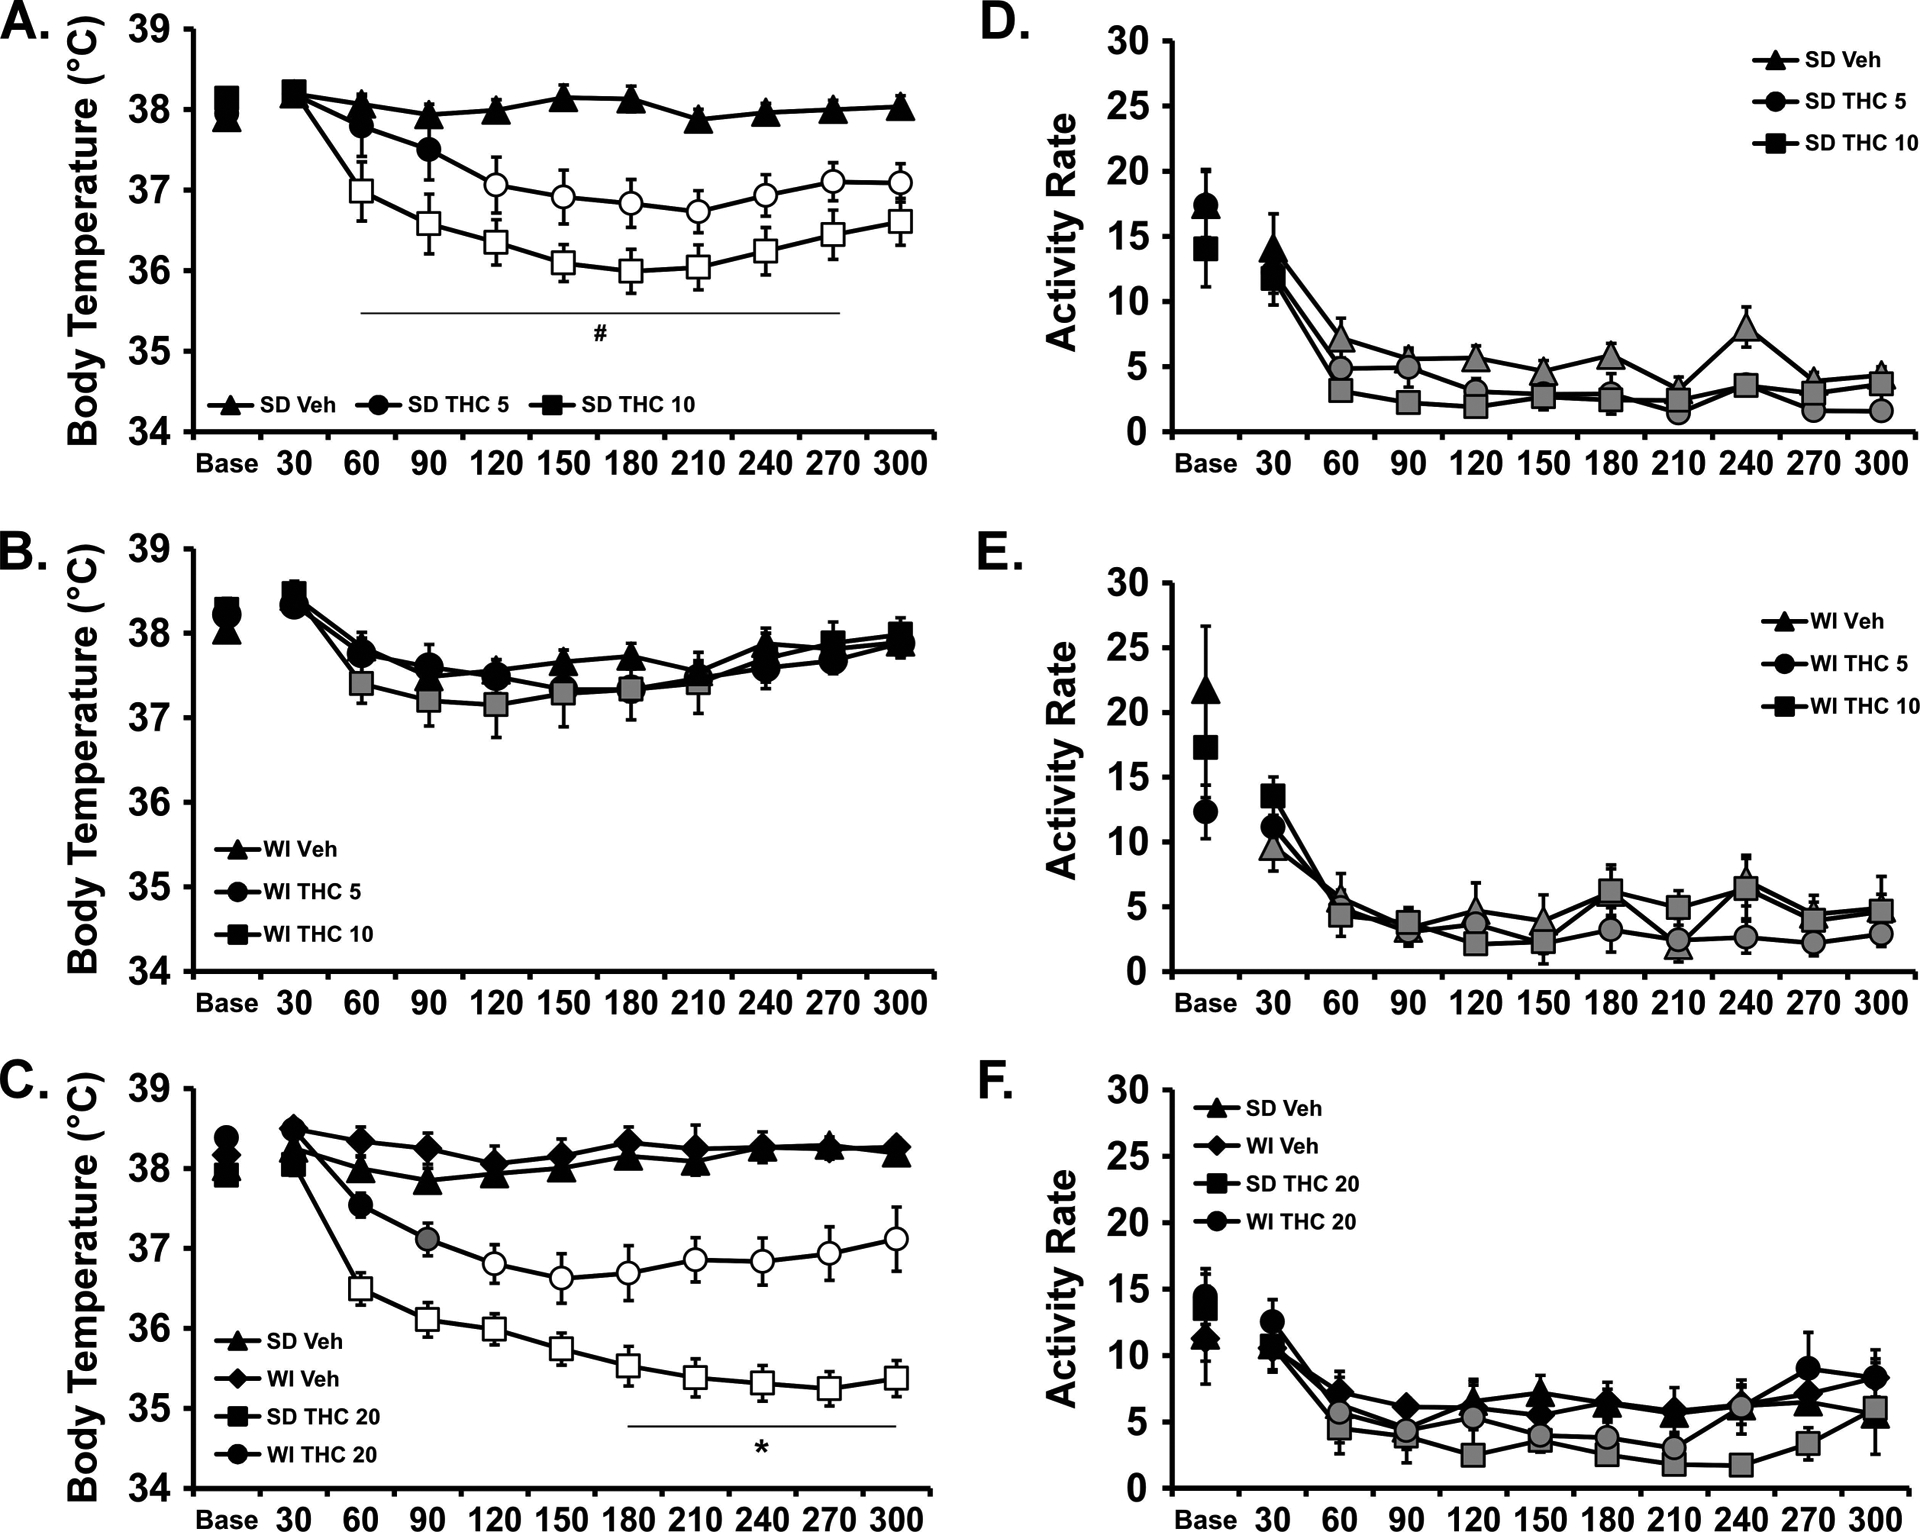
Figure 4:

Mean (N=8 / group; SEM) body temperature (A, B, C) and activity rate (D, E, F) following i.p. injection with THC. A,D) Sprague-Dawley and B,E) Wistar groups after injection with THC (0.0, 5.0, 10.0 mg/kg) and C,F) both groups after injection with THC (0.0, 20.0 mg/kg). Base=baseline. Open symbols indicate a significant difference from both vehicle at a given time-point and the within-treatment baseline, while shaded symbols indicate a significant difference from the baseline only. A significant difference from the 5.0 dose at a given time is indicated by # and between strains at a given time for the same dose by *.
