
Figure 2. KL-divergence minimization for aligning low-dimensional distributions.
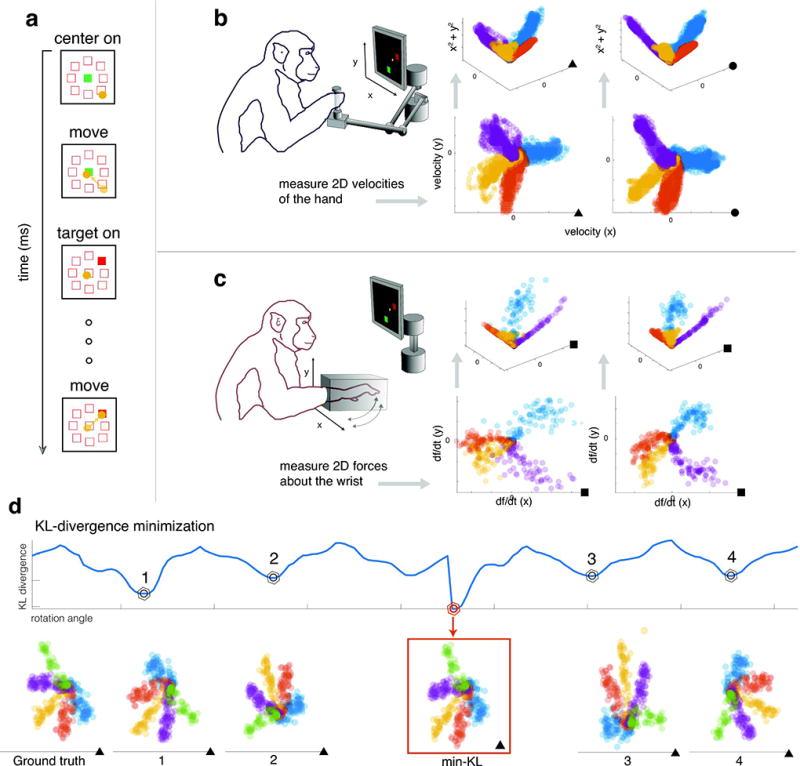
(a) The setup of the delayed center-out motor task. The task consists of 5 phases: a target appears at the center, the subject moves the cursor to the center, one of eight targets around the center will turn on, the subject must wait for a delay period to plan their movement, and finally they move a cursor towards the illuminated target. (b) A schematic of a monkey performing a reaching task by moving a 2D manipulandum towards the target. To the right, we show the kinematics (bottom) and 3D movement data when augmented with speed as a covariate (top). The kinematics data is shown with the target directions displayed as different colors. The resulting lifted 3D data lies on a conical shape in three dimensions. (c) A schematic of the force production task. Again, the datasets are conical in shape in 3D but the force distributions exhibit significant curvature compared to the reaching data. (d) Here we demonstrate the idea behind distribution alignment on artificially rotated kinematics data from Subject M. The KL-divergence is displayed as a function of the rotation angle used for alignment in 2D. The correct solution (ground truth), min-KL predicted solution, and four non-optimal rotations/reflections are displayed. Note that since the reflections of this task are roughly equivalent, the first local minimum (labeled as 1) of the KL-divergence is a ipped-version of the correct solution. Kinematics data from Subject M, C, and J are denoted by filled triangles, circles, and squares, respectively.