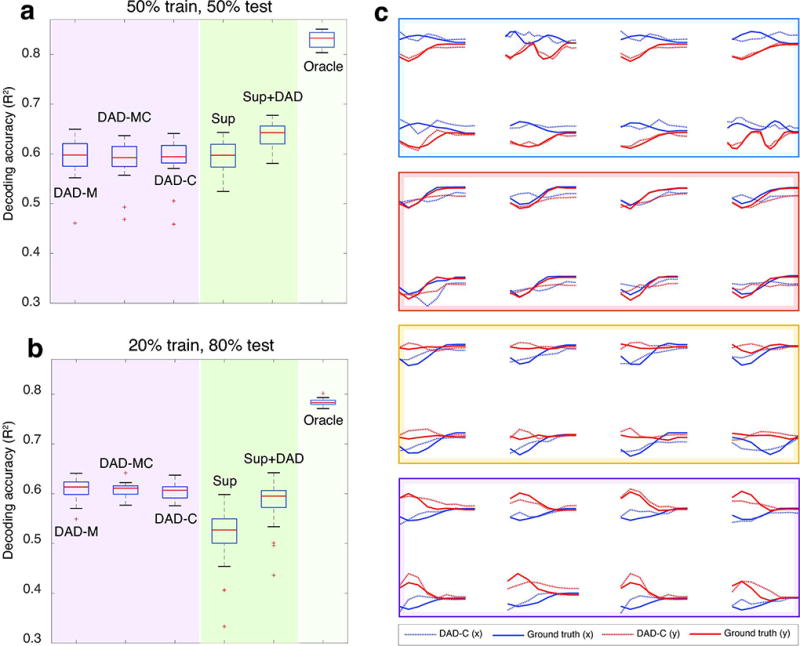
Figure 5. Decoding neural data using kinematics from another subject.

In (a–b), we show the results from three different decoding settings where we vary the training kinematics: DAD-M (train and test on M), DAD-MC (train on M,C and test on M), and DAD-C (train on C and test on M). Performance comparisons for supervised approaches (in shaded green regions) and DAD (in shaded purple regions) are shown for different amounts of training and test data. Each boxplot shows the R2 values obtained over 20 trials; the median is displayed as a red line in each box, the edges of the box represent the 25% and 75% percentile, the whiskers indicate the range of the data not considered an outlier, and the outliers are displayed in red (+). In (a) we show the R2 values obtained when we use 50% of the total data for training and 50% for test for Subject M and C, respectively. In (b), we display the R2 values obtained when we use 20% of the total data for training and 80% for test. Both (a,b) compare the performance of DAD, with a supervised linear decoder (Sup), the average between the predictions of Sup and DAD-M (Sup+DAD), and the Oracle. In (c), we show the R2 values obtained for DAD-C (dashed, R2=0.612), when overlaid on the true kinematics of individual reaches (solid). The horizontal and vertical velocities are displayed in blue and red, respectively. Eight randomly selected reaches are organized into colored boxes according to their corresponding target.
