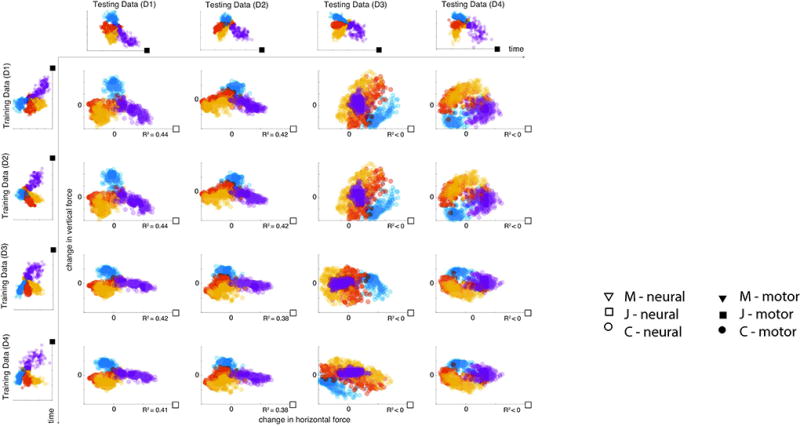
Figure 6. Aligning motor outputs across multiple days of recordings.

In this example, we apply DAD to datasets collected from Subject J over multiple recording sessions. Each subplot displays the decoded estimate of the change in applied forces obtained by DAD (colors indicate different targets). In each row, we show the effect of varying the testing data for a fixed training set (from left to right, D1, …, D4). In each column, we show the effect of varying the training data for a fixed testing set (from top to bottom, D1, …, D4). Kinematics and projected neural data from Subject J are marked with filled and open squares, respectively.
