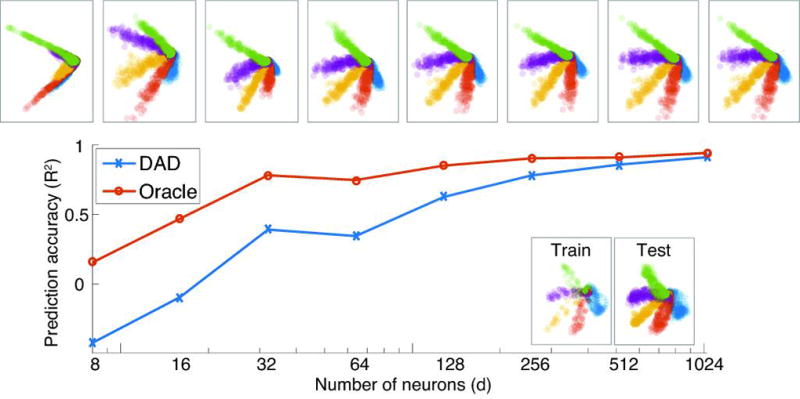
Figure 7. How distribution alignment scales with the number of recorded neurons.

To understand the limits of DAD, we visualize the performance of DAD on synthetic data as we increase the number of neurons in our model. As we increase the size of the neural population, we plot the trimmed mean of the R2 values (the top and bottom 10% of trials are removed) obtained for DAD and the Oracle, averaged over 100 trials. We show examples of alignments obtained as we increase the number of neurons in our synthetic model (above), as well as examples of training and test kinematics (at the bottom).
