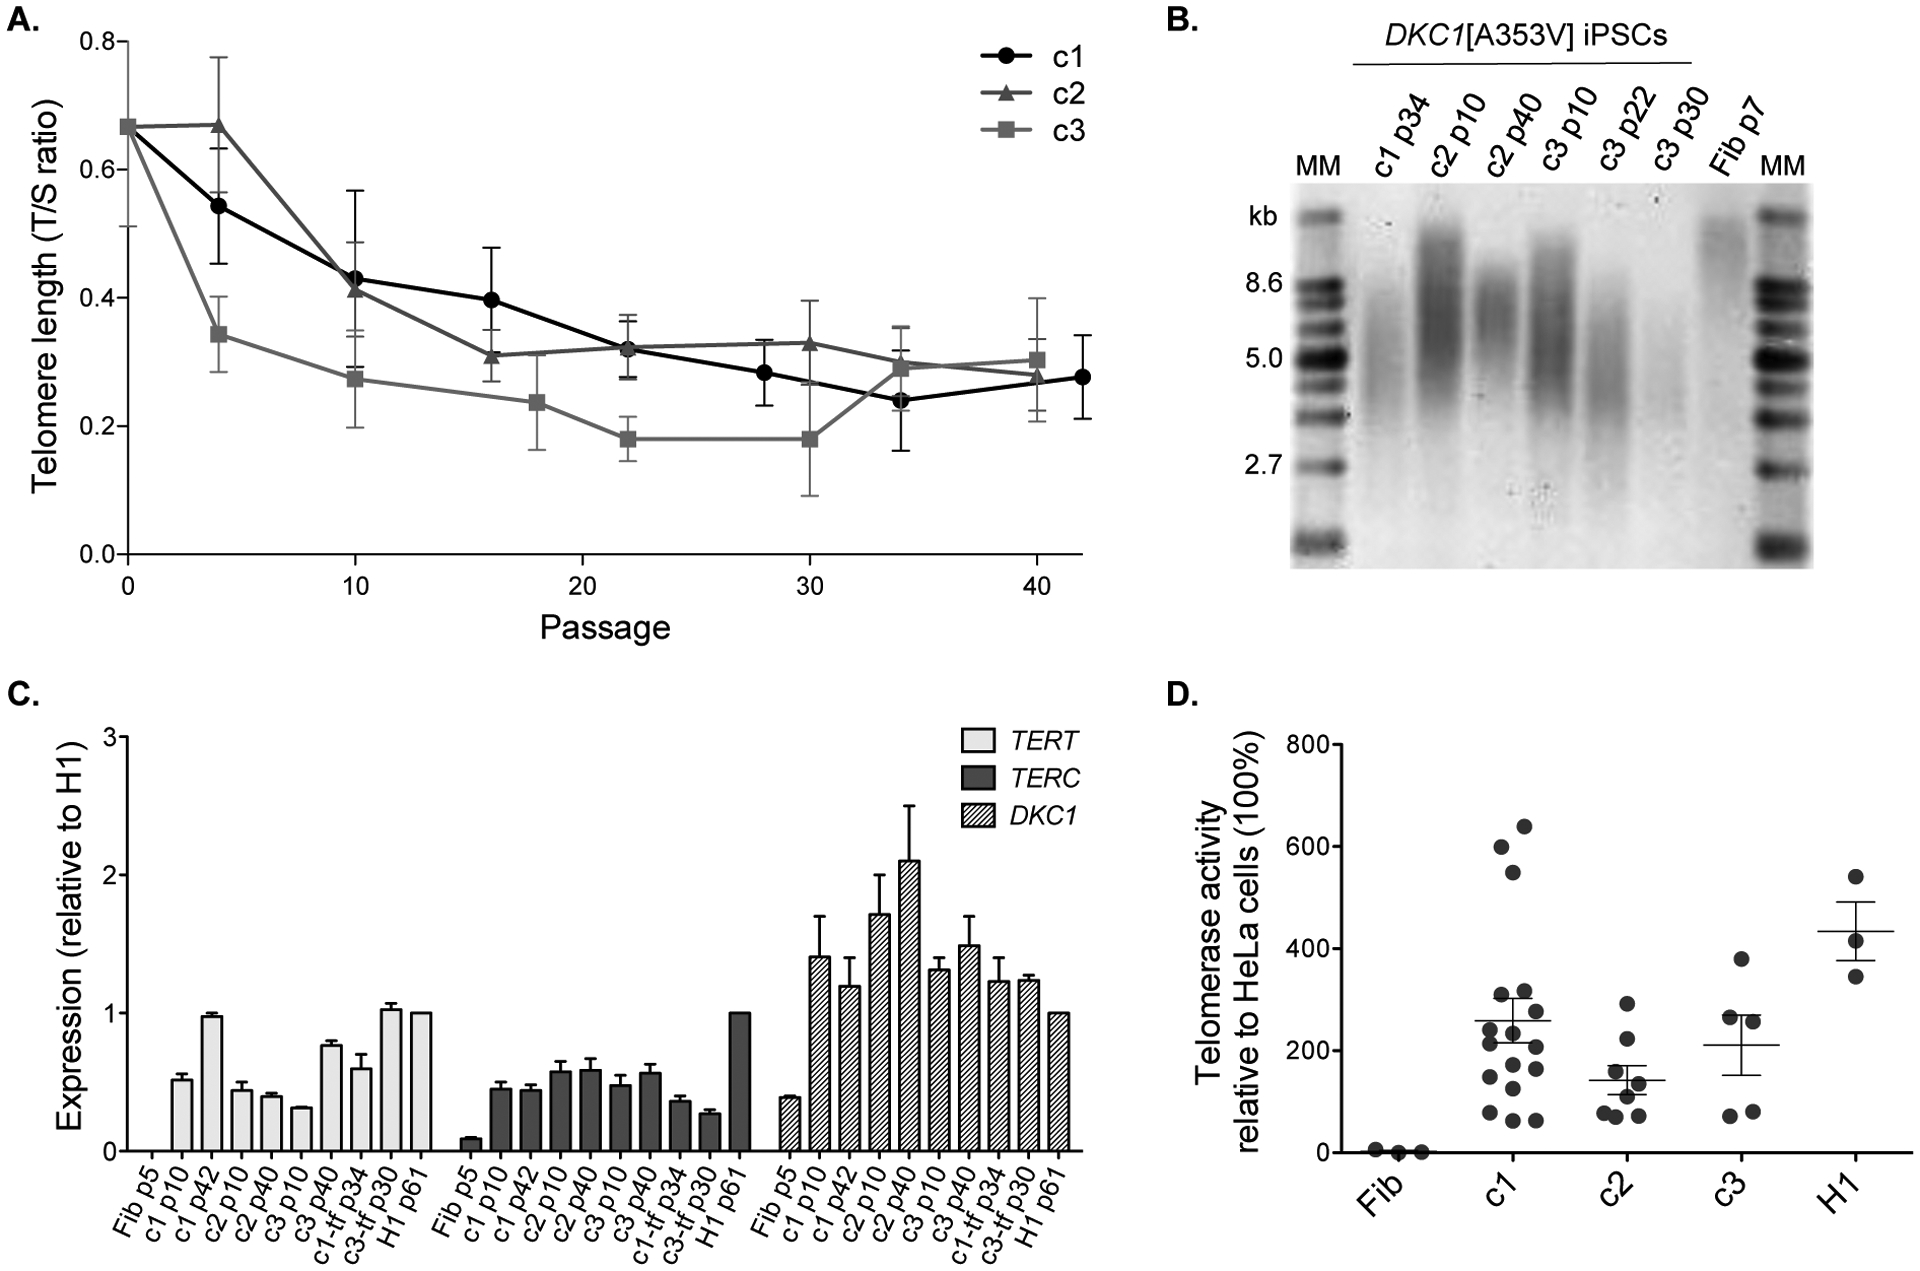
Figure 2 – Telomere length over time and telomerase activity in DKC1[A353V] iPSCs.

(A) Telomere lengths are represented as a T/S ratio. Passage 0 corresponds to the measurement of the parental fibroblasts (p7) immediately before reprogramming. (B) Telomere lengths by Southern blot from DKC1[A353V] fibroblasts (Fib p7) and iPSC clones 1, 2, and 3 at indicated passages (p). MM: molecular marker; kb: kilobases. (C) Expression levels of TERT, TERC, and DKC1 were assessed by RT-qPCR at different passages (p) in the clones (c) 1, 2, and 3, in the transgene-free clones 1-tf and 3-tf, and in the parental fibroblasts (Fib). The expression levels were normalized to GAPDH and then normalized to expression of the corresponding gene in H1 hESCs (control). (D) The telomerase activity of mutant iPSCs and H1 was measured using the TRAP assay and normalized to the activity of HeLa cells (set as 100%). Each circle represents a measurement of activity at a specific passage (p): fibroblasts at p7, iPSCs ranging from p8 to p116, and H1 at p35. Data on graph represent average and standard error of measurements at different passages for each clone or control. Activity was not statistically different (p > 0.05) between c1 and H1, and c3 and H1 (one-way ANOVA). Although the comparisons between fibroblasts and iPSCs were not statistically different, there is a clear trend of increased telomerase activity in the iPSC clones.
