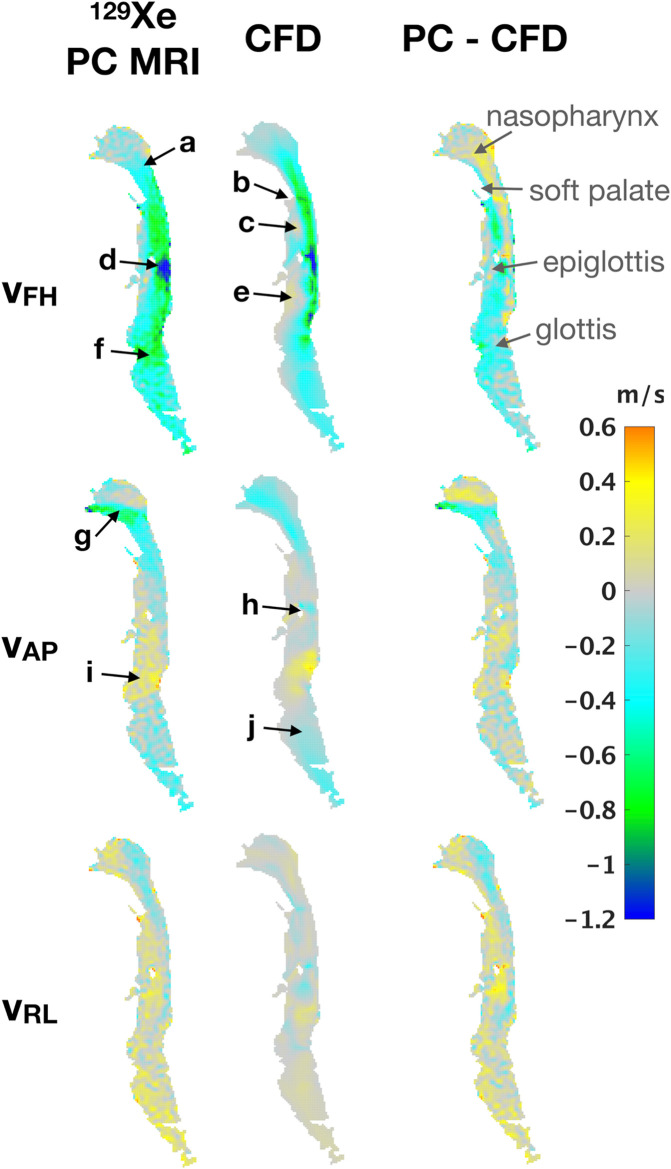
Fig 5. Side-by-side comparison of PC MRI and CFD.
Comparison of the foot-to-head, anterior-to-posterior, and right-to-left components of velocity for, left: A 129Xe gas PC MRI dynamic image (dynamic image #2 in Fig 4); middle: The CFD “slice” resulting from the regional averaging of the 3D CFD volume in to a 2D slice that corresponds to the PC MRI voxel data, as described in Fig 3); right: Voxel-wise difference between PC MRI and CFD data, highlighting regions of good and poor agreement. Labels a-j highlight important flow features highlighted in the main body text.

