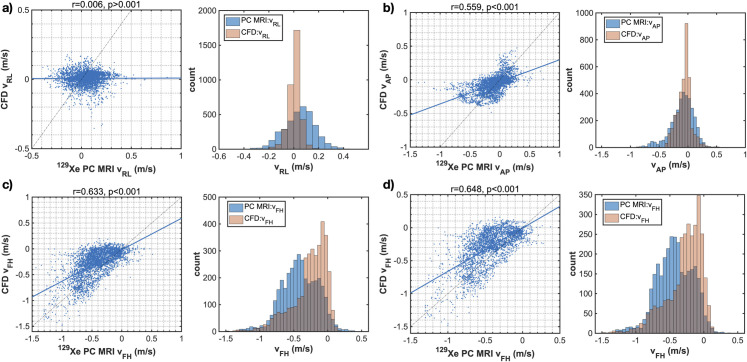
Fig 6. Correlation plots and histograms of agreement for each velocity component: PC MRI and CFD.
a) right-left component, b) anterior-posterior component, c) foot-head component. d) data in c) after removal (“erosion”) of the boundary layer of pixels from the 2D maps shown in Fig 5 (Subject 1). Solid blue lines indicate the line of best fit and dashed lines are the identity line. Histograms of velocity values derived from PC MRI and CFD are displayed in blue and red color, respectively.

