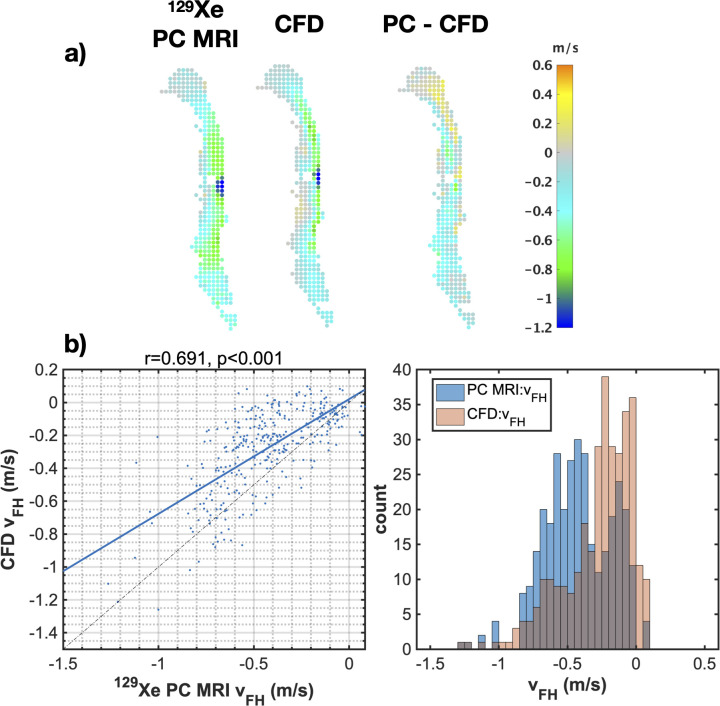
Fig 7. Effects of spatial down-sampling on PC MRI and CFD comparison.
a) 2D velocity (vFH) maps for PC MRI and CFD data and the difference between them, and b) correlation plots and histograms presented as in Fig 6, after down-sampling of the PC MRI data in plane by 3x3 voxels and re-sampling the CFD data to the corresponding resolution.

