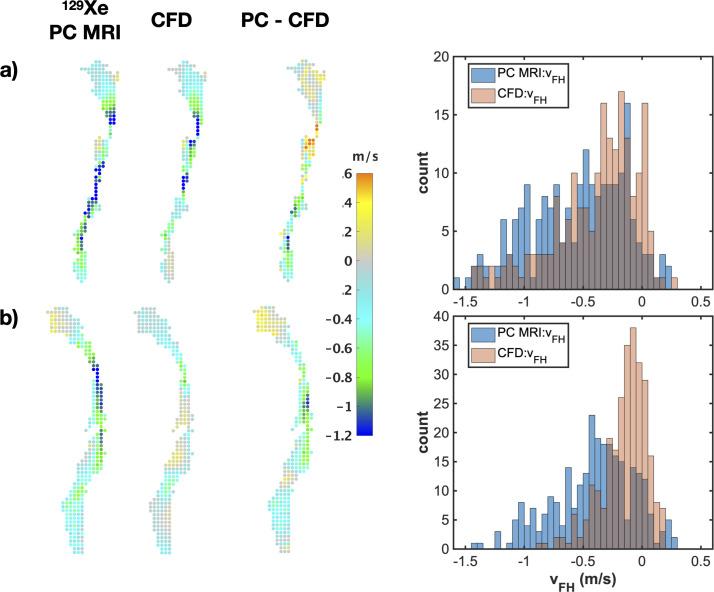
Fig 9. Side-by-side comparison of PC MRI and CFD: Additional examples.
Spatial comparison of 3x3 down-sampled foot-head velocity data from PC MRI and CFD, difference maps, and corresponding histograms of velocity values, for a) subject 2 and b) subject 3. Dataset shown is taken from the 3rd temporal dynamic image of the 129Xe PC MRI time series.

