
FIGURE 2.
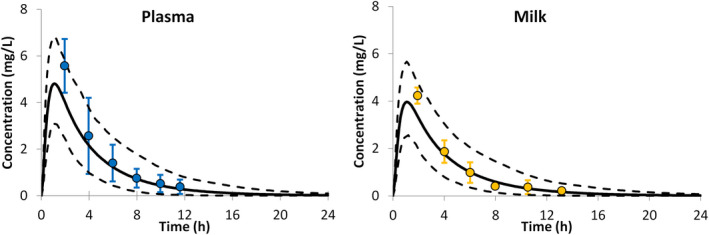
Acetaminophen concentration in plasma and in milk after a single oral administration of 500 mg. Circles with error bars represent the observed mean concentration and associated SD,20 the solid lines represent the predicted mean with the predictive 5th and 95th percentiles given as broken lines