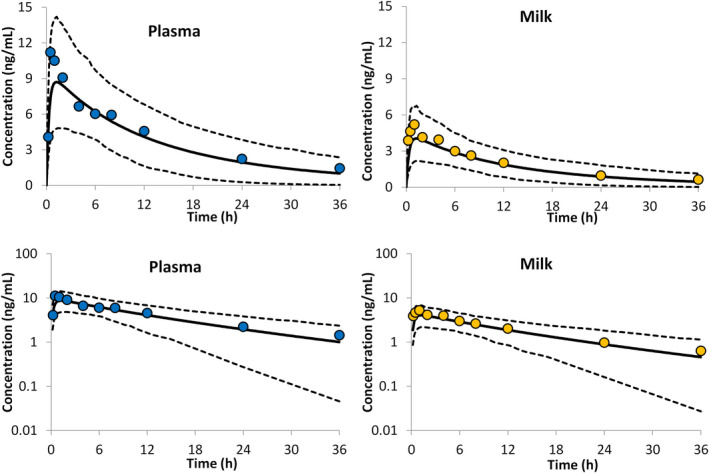
FIGURE 3.

Concentration time profiles of alprazolam in plasma (left) and in milk (right). Circles represent the reported mean values from eight lactating women,21 the lines represent the physiologically‐based pharmacokinetic (PBPK) predicted mean (solid lines) together with the predicted 5th and 95th percentiles (dashed lines). The lower panels show the concentration time profiles on log scales
