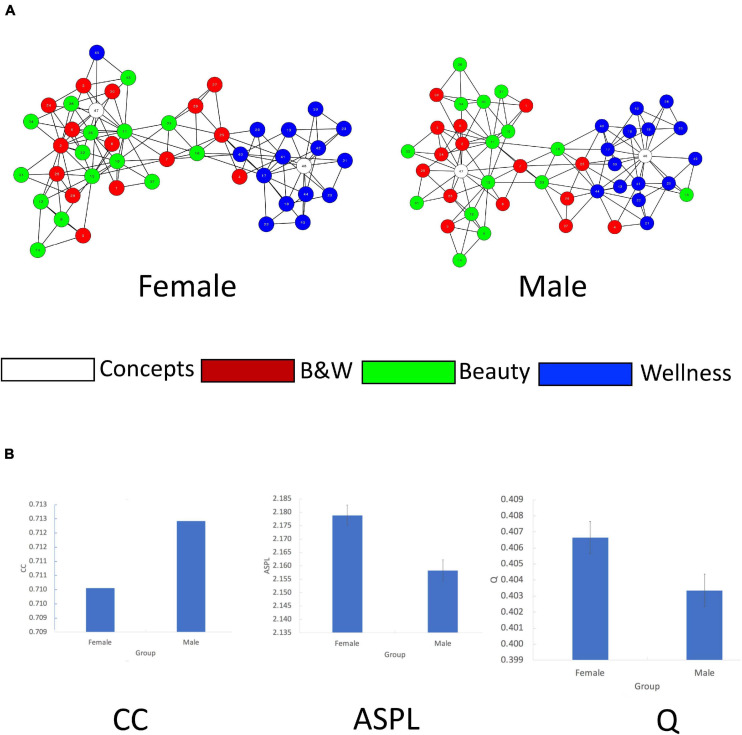
FIGURE 3.
Network analysis for Sex. (A) 2D visualization of the Sex 47 cue words (nodes) semantic networks. Edges denote symmetrical, binary relations between nodes. Colors represent category membership. Node numbers correspond to their word labels that appear in Appendix Table A1. (B) Bootstrapping analysis of CC, ASPL, and Q for the Sex groups. X-axes–Group, Y = axes–network measure (CC, ASPL, and Q) values.

