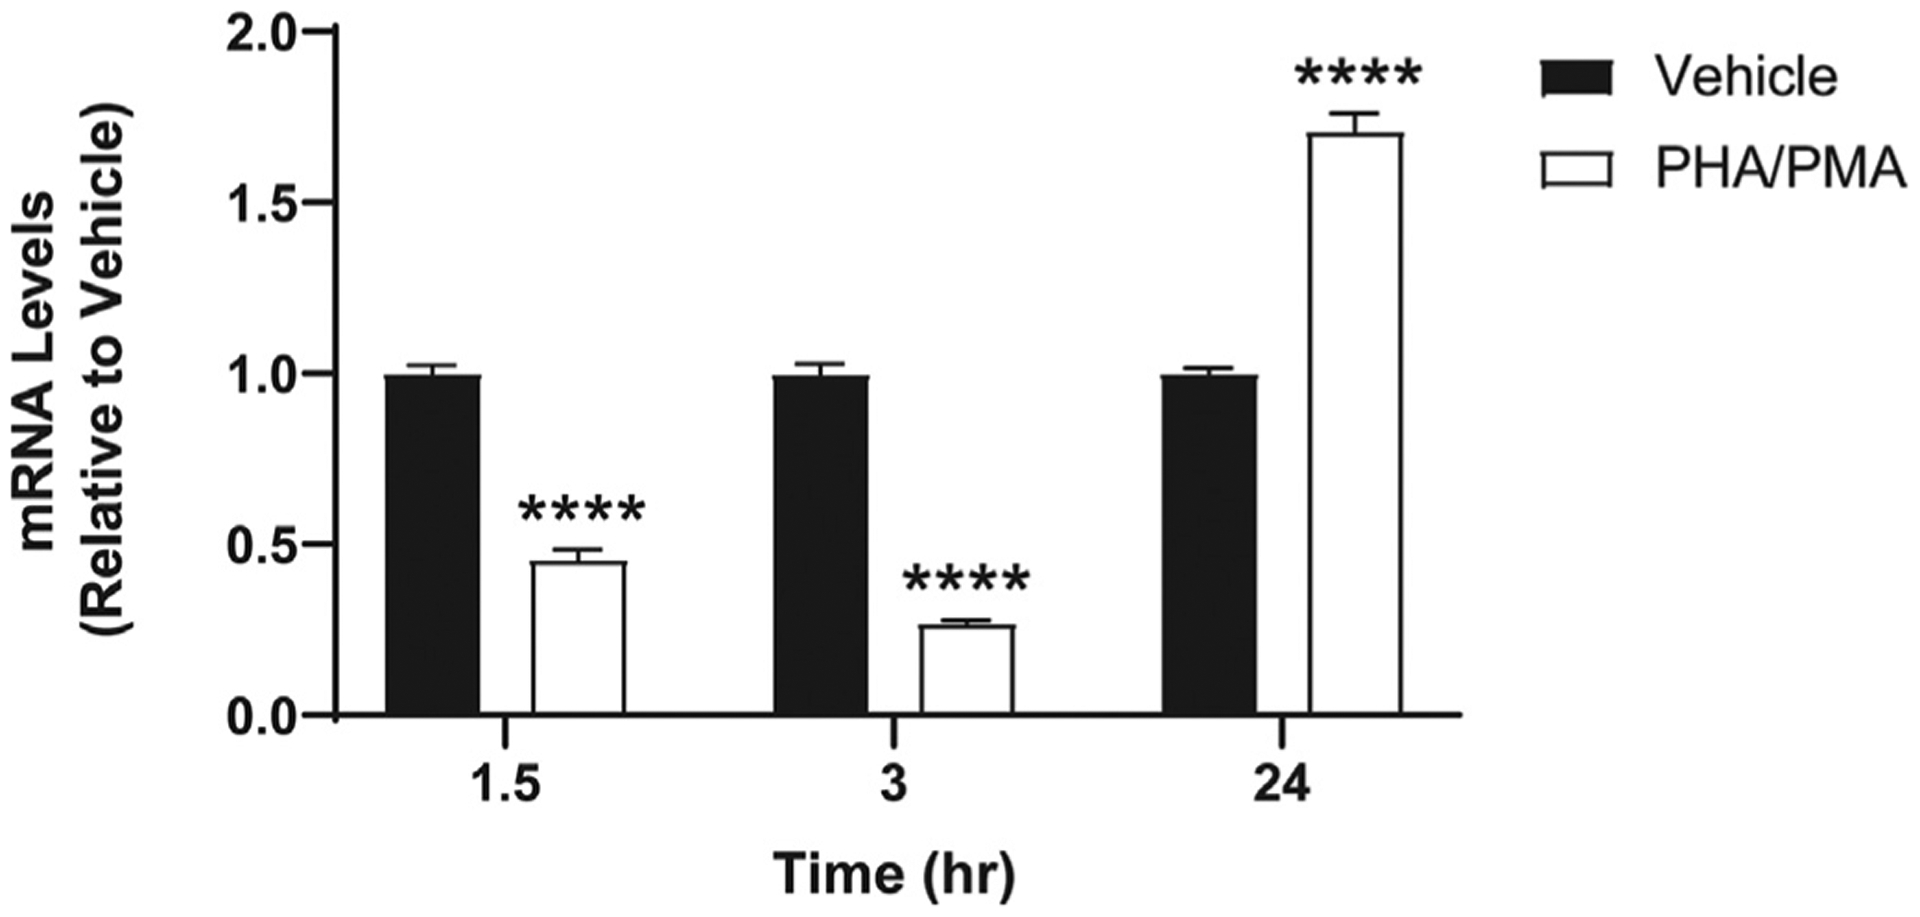
Fig. 2.

CB2 mRNA levels in Jurkat cells after PHA/PMA stimulation. Cells were treated with vehicle (equivalent volume of DMSO and water as the volumes of PHA and PMA used for treatment) or 1 μg/mL PHA and 12.5 ng/mL PMA for 1.5–24 h as described in Materials and Methods. Results are indicated as the mean ± S.E.M. of three independent assays performed in triplicate for each concentration. Student’s t-test was used and ****p < 0.05 versus vehicle control group.
