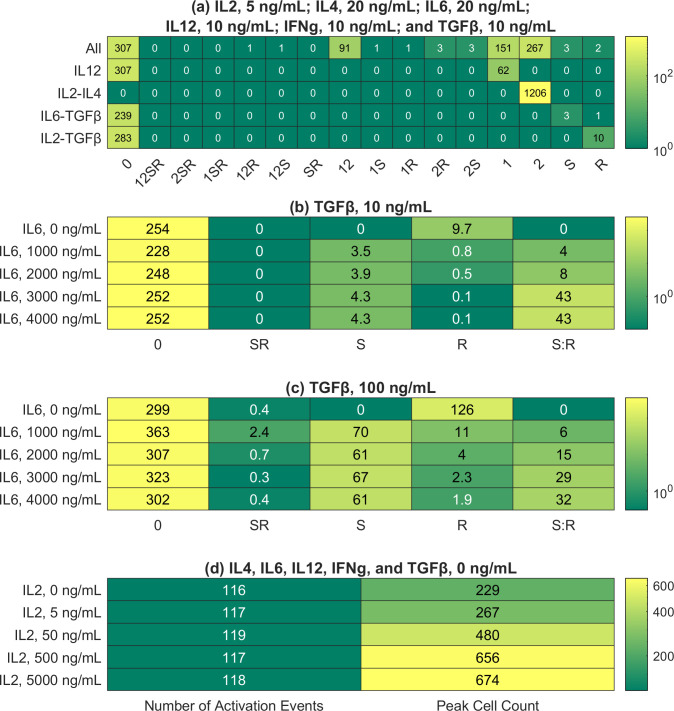
Fig 3. Peak CD4+ T cell responses in the presented simulations.
Each row represents the peak CD4+ T cell response in a Monte Carlo simulation, where 50 realizations of the modeled system were generated and averaged, thus explaining the continuous values (see Methods and S1 Text for details). The peak is defined as the time point with the maximum number of effectors and reactivated memory cells. In the column labels, 0 represents Th0; 1, Th1; 2, Th2; S, Th17; and R, Treg. A combination of symbols represents a mixed phenotype; for example, 12 represents the Th1-Th2 hybrid phenotype. (a) Phenotypic distributions of CD4+ T cells in different cytokine media. The initial cytokine concentrations were set to match an experimental study [25]. The first row represents the case with IL2, IL4, IL6, IL12, IFNγ, and TGFβ. (b) Phenotypic distributions of CD4+ T cells given different initial concentrations of IL6 (multiples of 20 ng/mL). In each simulation, the initial concentration of TGFβ was set to 10 ng/mL, while the other cytokine concentrations were set to zero. S:R denotes the ratio of Th17 count to Treg count (c) Same as (b), except the initial concentration of TGFβ was set to 100 ng/mL. (d) Total counts of naive cell activation and maximum cell counts given different initial concentrations of IL2 (multiples of 5 ng/mL). The initial concentrations of the remaining cytokines were set to zero.

