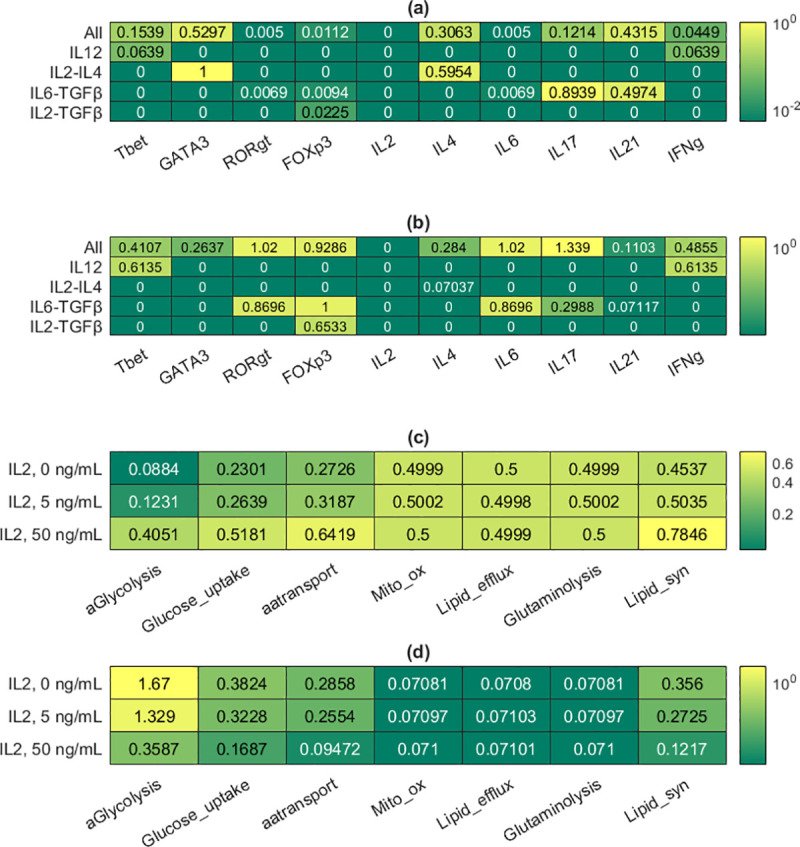
Fig 4. Representative results from the logical models.

Details about how the molecular models were used on their own can be found in Methods and S1 Text. (a) Mean activity levels of selected components of the logical model in the estimates of attractors corresponding to different cytokine inputs. (b) Standard deviation values associated with the mean activity levels in (a); each standard deviation was divided by its associated mean to generate the tabulated values. (c) Mean activity levels of all the metabolic components of the logical model in the estimates of attractors corresponding to different IL2 input levels (0, 5, and 50 ng/mL). 5 ng/mL is the baseline concentration. (d) Standard deviation values associated with the mean activity levels in (c); each standard deviation was divided by its associated mean to generate the tabulated values.
