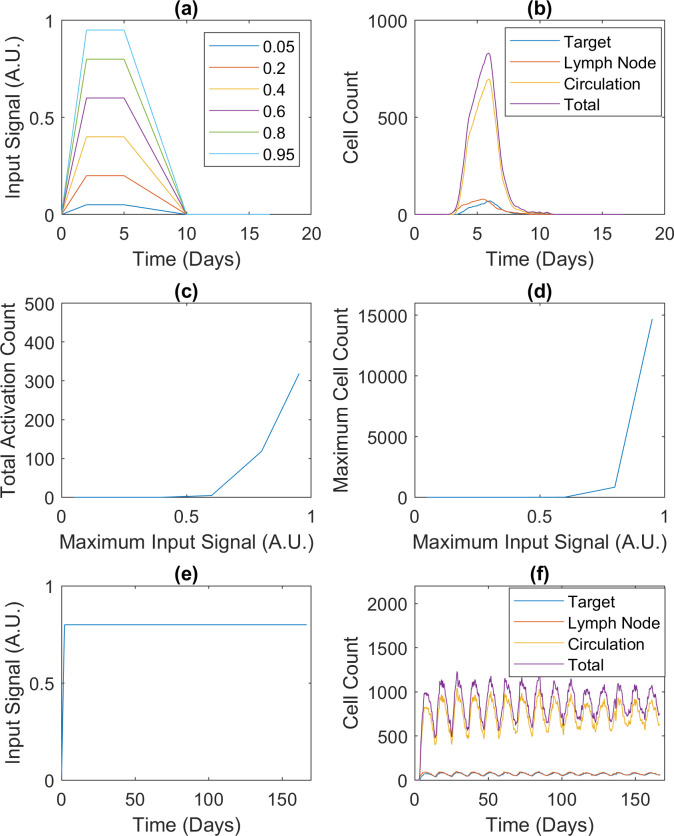
Fig 6. CD4+ T cell responses to different infections.
CD4+ T cell responses involve effectors and reactivated memory cells only. All cell counts are averages over 50 realizations. (a) Input signals representing acute infections with different peaks. The signal strength is in arbitrary units (A.U.). The signal labeled 0.8 represents the viral trajectory from an experimental study about influenza [20] and is known as the default input signal in this paper. (b) Population dynamics in response to the default input signal. (c) and (d) Total counts of naive cell activation and maximum cell counts corresponding to the input signals in (a). (e) Input signal representing a hypothetical chronic infection. (f) Population dynamics in response to the input signal in (e). Details about the signals and simulations can be found in Methods and S1 Text.

