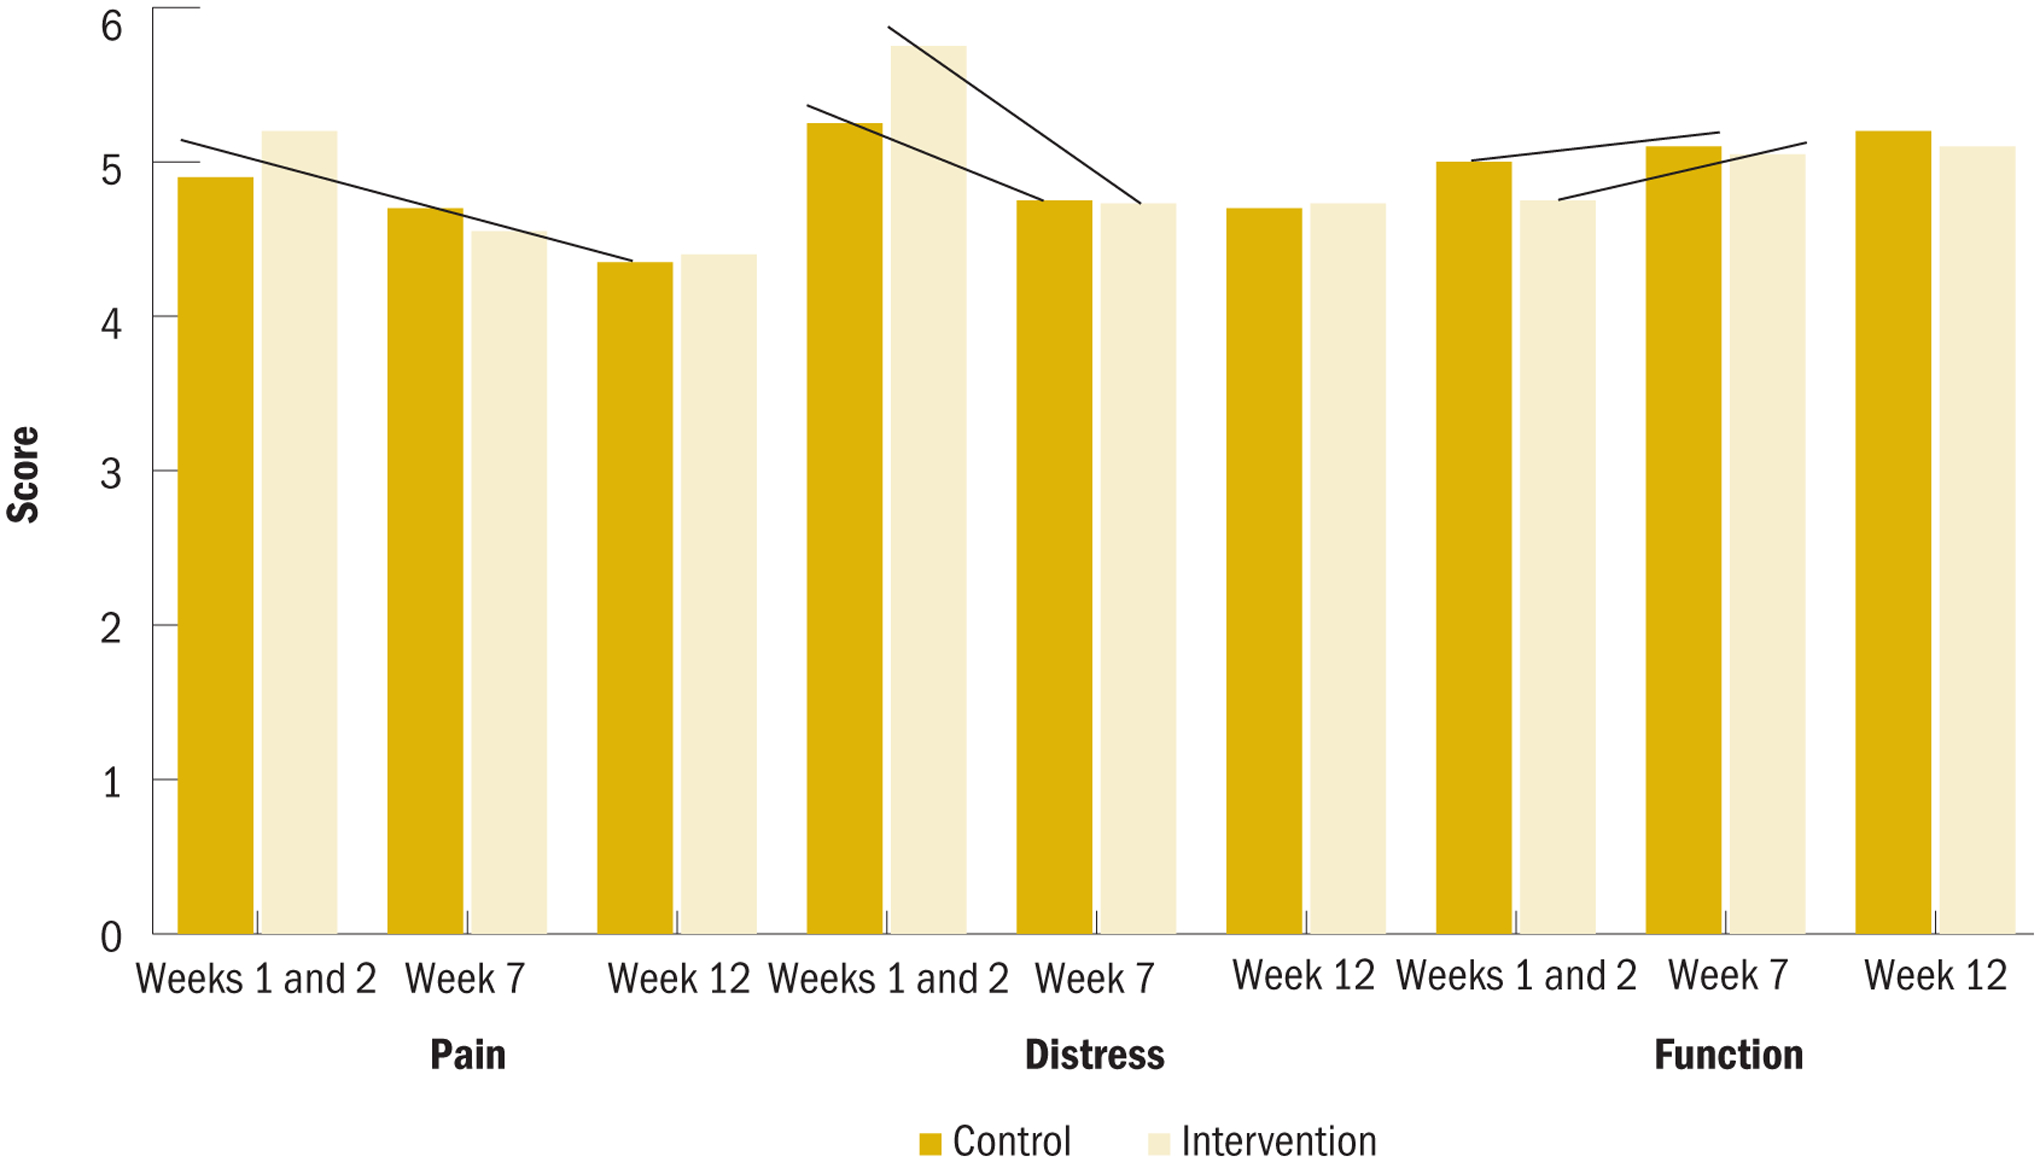
FIGURE 3.

Primary Outcomes by Intervention Group and Week (N = 310)
Note. Weeks 1 and 2 were averaged for baseline.
Note. Lines above bars highlight significant trends and interactions.
Note. Scale ranges were as follows: pain (0–10), distress (0–10), and functional status (2.8–7.5). Higher scores indicate more of the construct.
